

In today’s fast-paced manufacturing environment, success depends on your ability to make data-driven decisions in real time. The Manufacturing KPI Dashboard in Power BI is a ready-to-use analytics solution that empowers manufacturers to track, analyze, and optimize their operations effortlessly. ⚙️📊
Whether you manage multiple plants or oversee a single production line, this dynamic Power BI dashboard brings all your performance indicators together in one place — enabling you to identify inefficiencies, boost productivity, and achieve operational excellence.
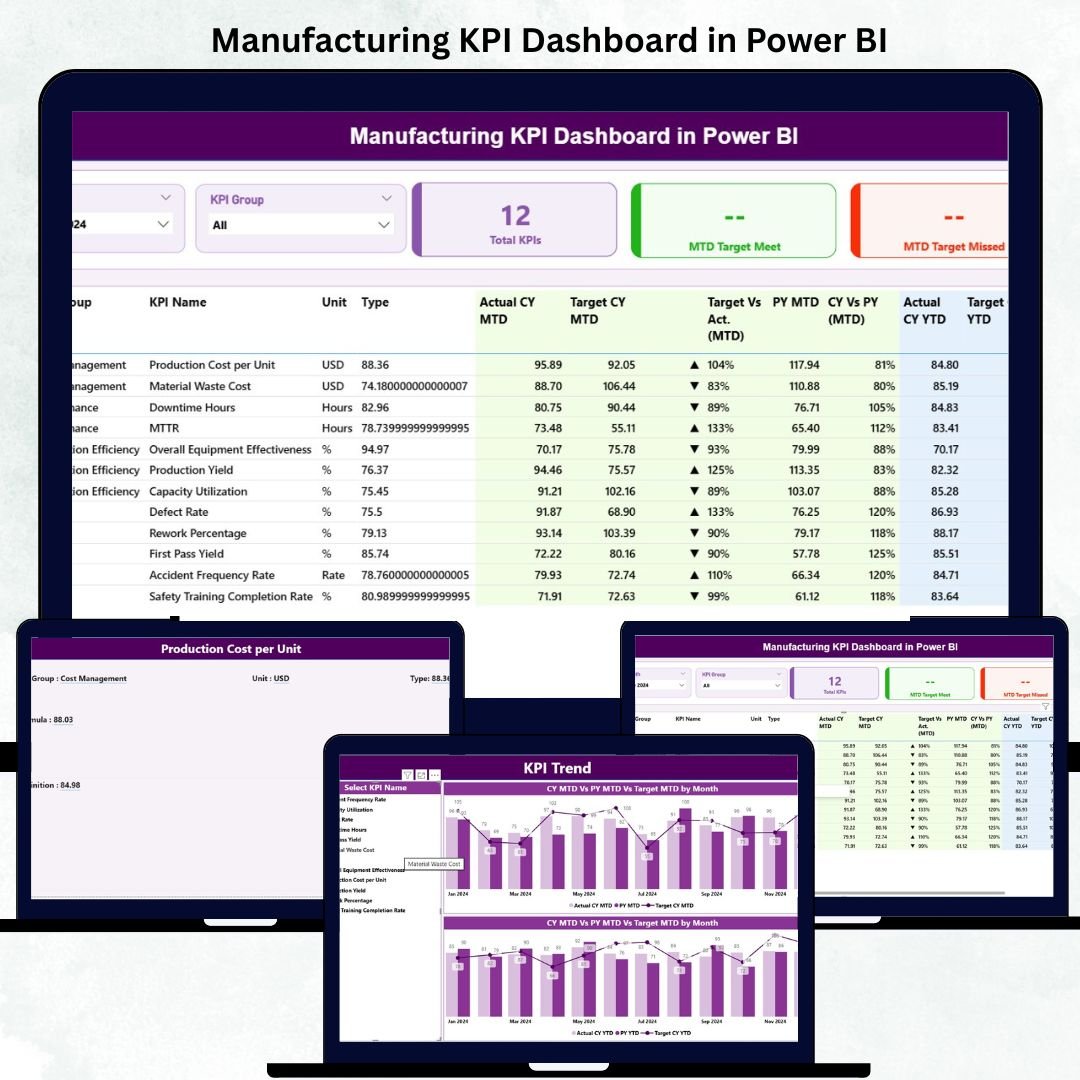
🧩 Key Features of Manufacturing KPI Dashboard in Power BI
✨ Interactive Dashboard Pages — The dashboard includes Summary, KPI Trend, and KPI Definition pages that offer a comprehensive view of manufacturing performance.
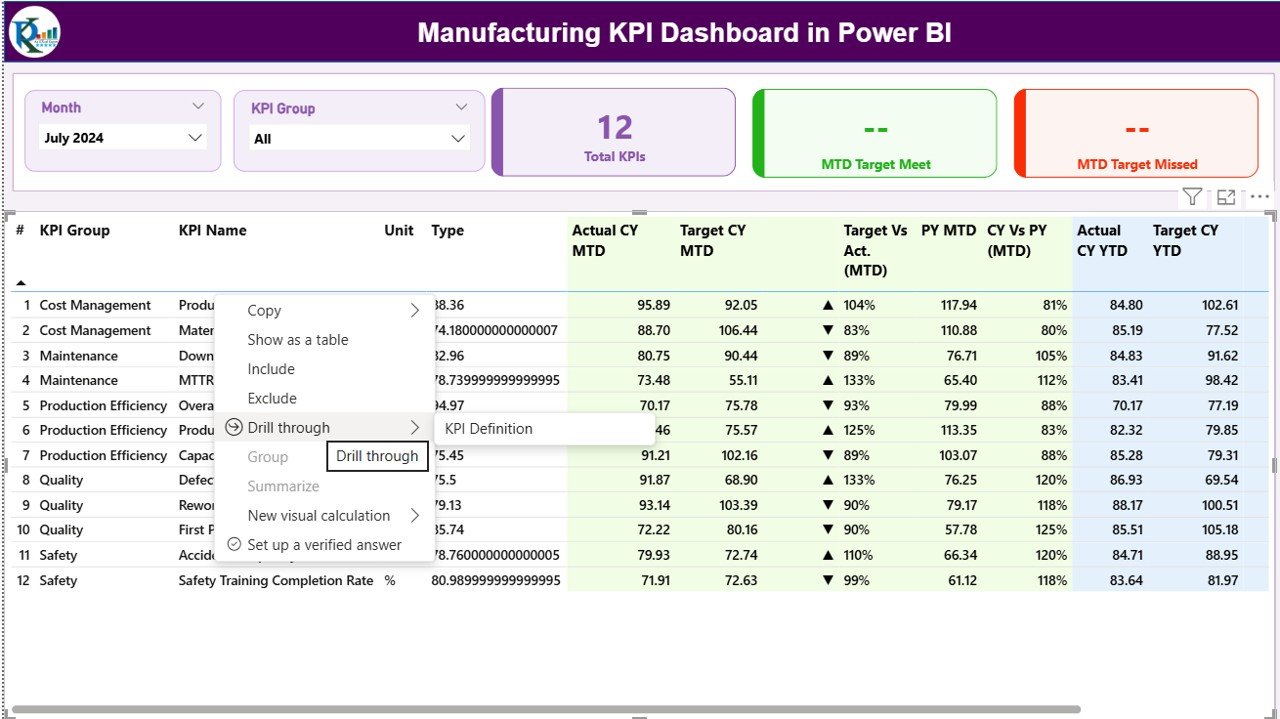
📊 Dynamic KPI Cards — Instantly view Total KPIs, MTD Target Met, and MTD Target Missed with color-coded visuals for quick decision-making.
📅 Smart Filters — Use slicers to analyze KPIs by Month or KPI Group, helping you focus on specific timeframes or process areas.
📈 Visual Trend Analysis — Compare Current Year vs Previous Year vs Target performance using easy-to-read charts.
🔁 Auto Data Refresh — Linked directly to Excel, ensuring that your dashboard always displays the latest data without manual updates.
🧮 KPI Definition Page — Drill through any KPI to see its Formula, Definition, and Type (LTB/UTB), ensuring full transparency and traceability.
🎨 Customizable Interface — Modify visuals, colors, or data fields in Power BI Desktop to match your organization’s branding or reporting style.

📦 What’s Inside the Manufacturing KPI Dashboard in Power BI
This professionally designed Power BI file connects seamlessly with an Excel data source. Inside the Excel workbook, you’ll find three core sheets:
📘 Input_Actual Sheet: Enter actual monthly performance data for each KPI.
📗 Input_Target Sheet: Define monthly target values to compare against real outcomes.
📙 KPI Definition Sheet: Document every KPI with its group, formula, unit, and type.
With this structured setup, Power BI automatically updates visuals and metrics as soon as you modify your Excel data — no technical expertise required!
🪄 How to Use the Manufacturing KPI Dashboard in Power BI
1️⃣ Import Data — Connect the provided Excel workbook to Power BI.
2️⃣ Refresh Dashboard — Update your MTD and YTD values and refresh to see live results.
3️⃣ Analyze Performance — Use slicers on the Summary Page to review results by month or KPI group.
4️⃣ Explore Trends — Dive into the KPI Trend Page to spot growth opportunities or bottlenecks.
5️⃣ Understand KPIs — Use the KPI Definition Page to review formulas and measurement details.
6️⃣ Share Insights — Export visuals or publish the dashboard on Power BI Service for your team.
This makes it easy for manufacturers to monitor critical metrics like production output, machine downtime, quality levels, and overall equipment efficiency (OEE) — all from a single visual interface.
🎯 Who Can Benefit from This Manufacturing KPI Dashboard in Power BI
🏭 Plant Managers: Monitor daily production targets and operational efficiency.
🧑🔧 Quality Teams: Track defects, downtime, and process variations.
👨💼 Operations Heads: Evaluate overall performance across multiple units.
💼 Executives & Directors: Get a high-level overview of business performance.
📦 Supply Chain Managers: Analyze delivery reliability, inventory turns, and lead times.
🧾 Finance Teams: Measure cost efficiency and ROI through performance-based data.
This dashboard is perfect for manufacturers who want to transform complex production data into meaningful, actionable insights — without coding or expensive software.
🔗 Click here to read the detailed blog post
Watch the step-by-step video tutorial:
Visit our YouTube channel to learn step-by-step video tutorials. 🎥


Reviews
There are no reviews yet.