


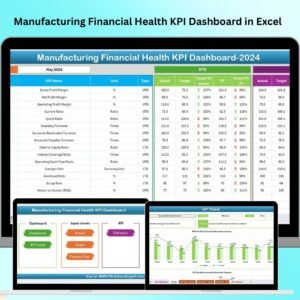
The Manufacturing Financial Health KPI Dashboard in Excel is a comprehensive tool designed to help manufacturing businesses monitor and optimize their financial performance. This Excel-based dashboard tracks key performance indicators (KPIs) related to manufacturing costs, revenue, profitability, and overall financial health, allowing business owners and managers to make data-driven decisions to improve profitability and reduce inefficiencies.
The dashboard integrates critical financial metrics like cost of goods sold (COGS), profit margins, inventory turnover, and more, giving you real-time insights into the financial status of your manufacturing operations. With its user-friendly interface and customizable features, the dashboard can be tailored to meet the specific needs of your business.
Key Features of the Manufacturing Financial Health KPI Dashboard in Excel
📊 Comprehensive Financial KPIs
Monitor critical financial KPIs such as profit margins, revenue growth, COGS, and operating expenses to gain a clear understanding of your company’s financial health.
📈 Cost Tracking & Profitability Analysis
Track costs related to manufacturing processes and measure profitability at different stages of production. This feature helps you identify areas where costs can be reduced and margins can be improved.
💰 Revenue & Expense Tracking
Track both revenue and expenses in real-time to assess the overall profitability of your manufacturing operations. This allows you to identify trends and make adjustments to enhance profitability.
📉 Inventory Turnover Monitoring
Monitor the efficiency of your inventory management by tracking inventory turnover rates. This helps reduce holding costs and optimize stock levels to prevent overstocking or stockouts.
⚙️ Customizable Dashboards & Reports
Tailor the dashboard to reflect the most relevant financial metrics for your manufacturing business. Customize fields, KPIs, and reporting features to meet your specific operational goals.
🔄 Real-Time Data Integration
Integrate real-time data from various sources to ensure that you’re always working with the most up-to-date financial information, providing a clear and accurate picture of your business’s financial health.
Why You’ll Love the Manufacturing Financial Health KPI Dashboard in Excel

✅ Track Financial Performance
Monitor key financial metrics such as profit margins, revenue, and expenses in real time. Get a comprehensive overview of your manufacturing operations’ financial health.
✅ Optimize Profitability
Use detailed financial analysis to reduce manufacturing costs, improve profit margins, and identify areas for operational improvement. Make data-driven decisions that directly impact your bottom line.
✅ Streamline Cost Management
Identify areas of excessive spending and track cost reductions across your operations. This feature helps you improve your cost efficiency and increase profitability.
✅ Improve Inventory Management
Track inventory turnover and optimize your stock levels. This helps reduce inventory holding costs and ensures that you maintain optimal stock levels without overstocking or understocking.
✅ Customizable & Scalable
The dashboard is highly customizable and can be adapted to suit the unique needs of your manufacturing business. It can scale to accommodate businesses of any size, from small manufacturers to large production facilities.
What’s Inside the Manufacturing Financial Health KPI Dashboard in Excel?
-
Comprehensive Financial KPIs: Track profit margins, revenue, expenses, and more.
-
Cost Tracking & Profitability Analysis: Monitor and reduce manufacturing costs to improve profitability.
-
Revenue & Expense Tracking: Track revenue and expenses to assess overall profitability.
-
Inventory Turnover Monitoring: Monitor and optimize your inventory management.
-
Customizable Dashboards & Reports: Tailor the dashboard to your specific financial reporting needs.
-
Real-Time Data Integration: Ensure that you are always working with the latest financial data.
How to Use the Manufacturing Financial Health KPI Dashboard in Excel
1️⃣ Download the Template: Access the Manufacturing Financial Health KPI Dashboard in Excel instantly.
2️⃣ Input Financial Data: Enter your revenue, expenses, and cost-related data to start tracking KPIs.
3️⃣ Track Key Metrics: Monitor profit margins, COGS, and inventory turnover in real-time.
4️⃣ Generate Reports: Use the customizable reports to assess your financial health and track trends.
5️⃣ Optimize Operations: Use the insights to improve cost management, profitability, and overall financial efficiency.
Who Can Benefit from the Manufacturing Financial Health KPI Dashboard in Excel?
🔹 Manufacturing Business Owners
🔹 Production Managers & Operations Managers
🔹 Financial Analysts & Controllers
🔹 Supply Chain & Inventory Managers
🔹 Small & Medium Manufacturers
🔹 Large Manufacturing Enterprises
🔹 Financial Advisors & Consultants in Manufacturing
Gain a clearer understanding of your manufacturing business’s financial health with the Manufacturing Financial Health KPI Dashboard in Excel. Track, analyze, and optimize your financial performance to improve profitability and streamline operations.
Click here to read the Detailed blog post
Visit our YouTube channel to learn step-by-step video tutorials
Youtube.com/@PKAnExcelExpert


Reviews
There are no reviews yet.