Managing a luxury brand means maintaining perfection across every detail — from craftsmanship and exclusivity to profitability and customer experience. The Luxury Goods KPI Scorecard in Excel is a powerful, ready-to-use performance tracking tool that enables luxury businesses to measure what truly matters.
Whether you manage a fashion house, jewelry brand, watch retailer, or high-end boutique, this Excel-based system gives you a 360° view of your sales, marketing, supply chain, and customer service performance — all within a single interactive file.
Built entirely in Microsoft Excel, this template delivers real-time insights through KPIs, charts, and automated comparisons, helping executives make fast, data-backed decisions without needing complex software or coding knowledge.
⚙️ Key Features of the Luxury Goods KPI Scorecard in Excel
📊 Four Main Sheets – Scorecard, KPI Trend, Input Data, and KPI Definition.
📅 MTD & YTD Analysis – Track performance month-to-date or year-to-date with dropdown filters.
🎯 Actual vs Target Tracking – Instantly compare goals against real results.
📈 Visual Indicators – Conditional formatting with arrows or traffic lights for instant clarity.
💡 KPI Trend Charts – Graphical analysis of performance patterns over time.
📘 Predefined KPI Library – Covers financial, operational, and marketing indicators.
⚙️ Auto-Refresh Calculations – Charts and metrics update automatically with new data.
🧩 Fully Customizable – Add or modify KPIs to match your luxury business model.
💻 No Technical Skills Required – Designed for simplicity and accessibility.
📤 Presentation-Ready Design – Ideal for management meetings or client reporting.
📂 What’s Inside the Luxury Goods KPI Scorecard
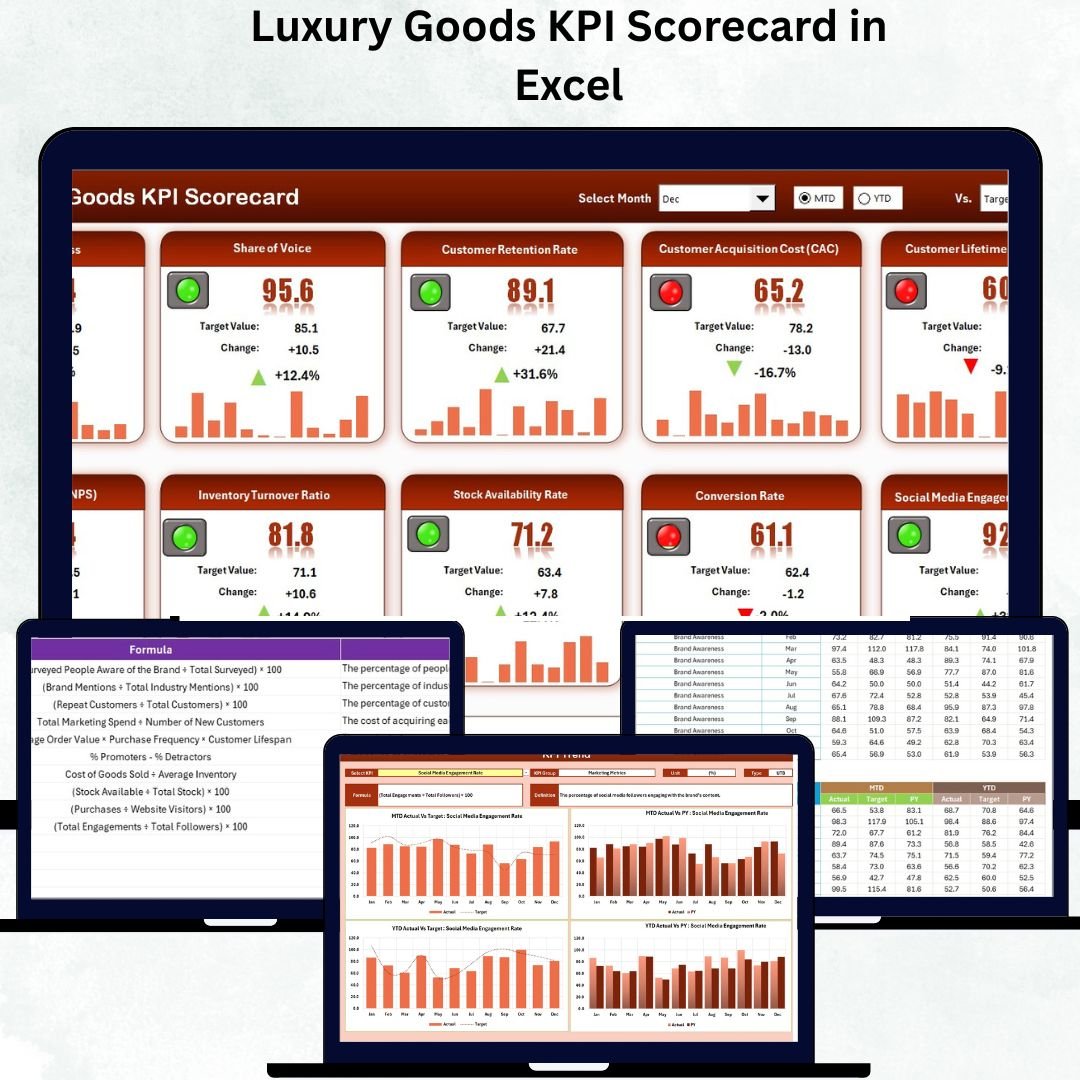
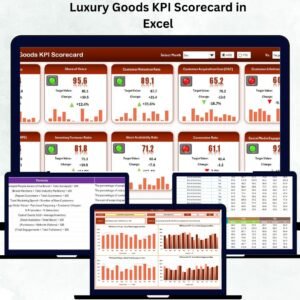
💼 1️⃣ Scorecard Sheet – Executive Dashboard
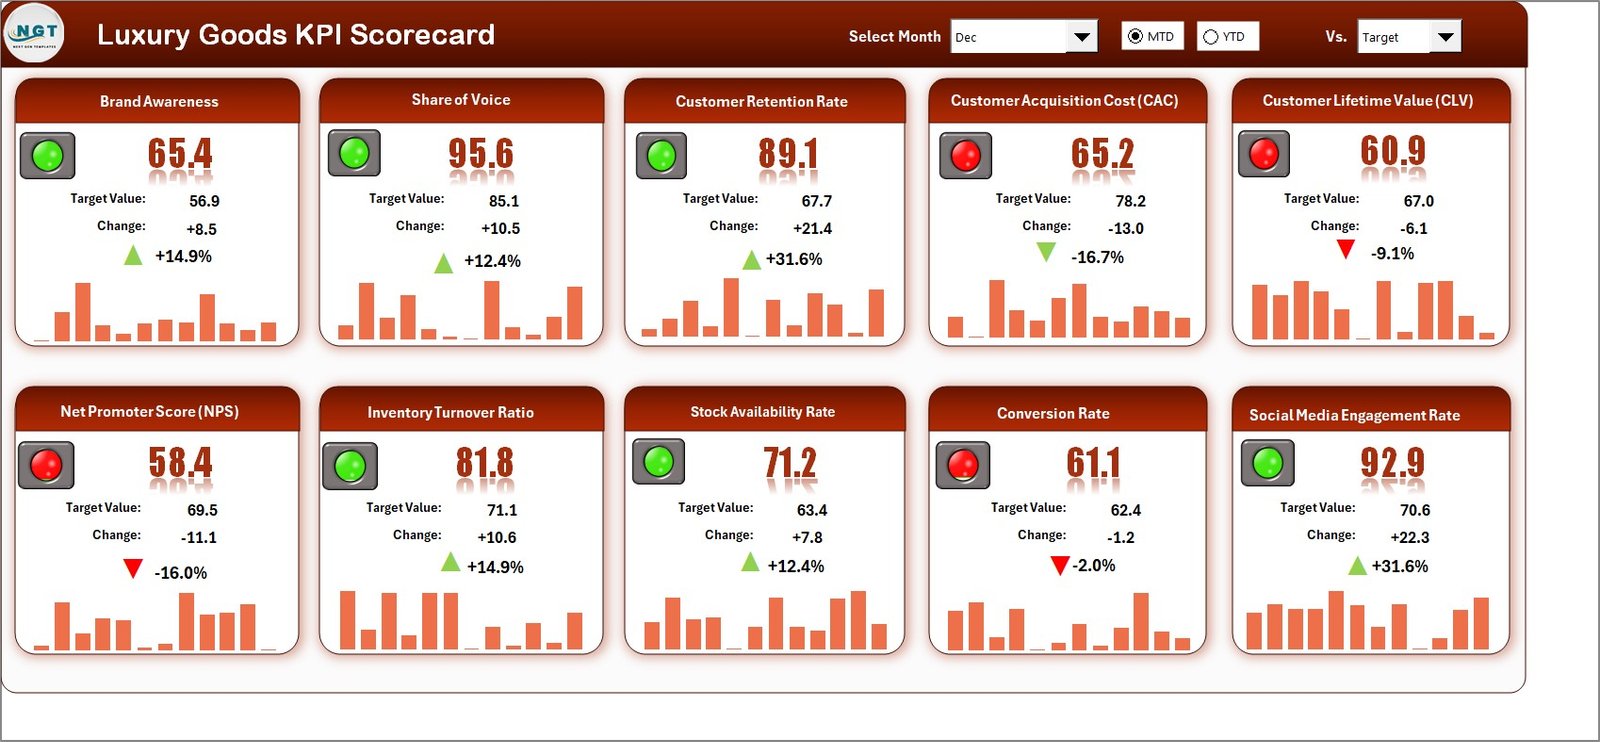
Your main control center for tracking brand performance.
-
Dropdown selectors for Month and Analysis Type (MTD/YTD).
-
Automatically updates KPI results and comparisons.
-
Visual indicators (green/red arrows) highlight performance status.
-
Displays Actual vs Target and Previous Year comparisons.
Example KPIs:
💰 Total Sales Revenue
💎 Average Transaction Value
📈 Gross Profit Margin
🛍️ Customer Retention Rate
🌍 Revenue per Region
This clean, visual layout helps executives instantly identify trends, gaps, and achievements.
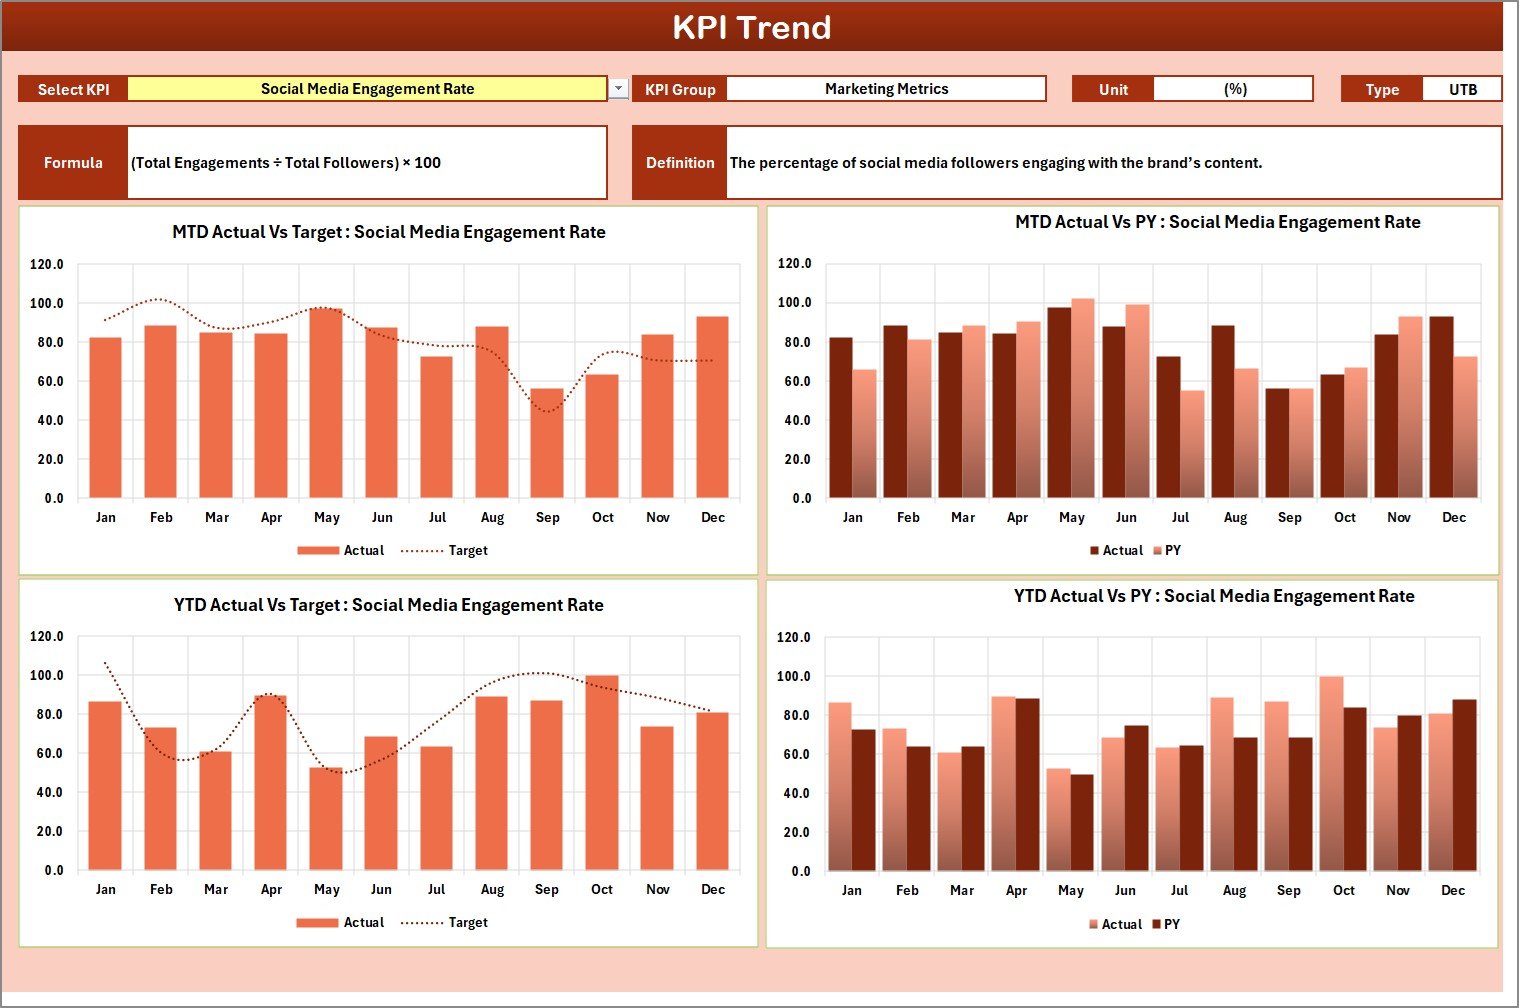
📊 2️⃣ KPI Trend Sheet – Deeper Performance Insights
Drill down into individual KPIs and monitor historical progress.
-
Dropdown (cell C3) to select any KPI for analysis.
-
Displays KPI Group, Unit, Formula, and Type (UTB/LTB).
-
Includes MTD and YTD trend charts comparing Actual, Target, and Previous Year.
📈 Ideal for identifying emerging patterns, forecasting future performance, and guiding strategic actions.
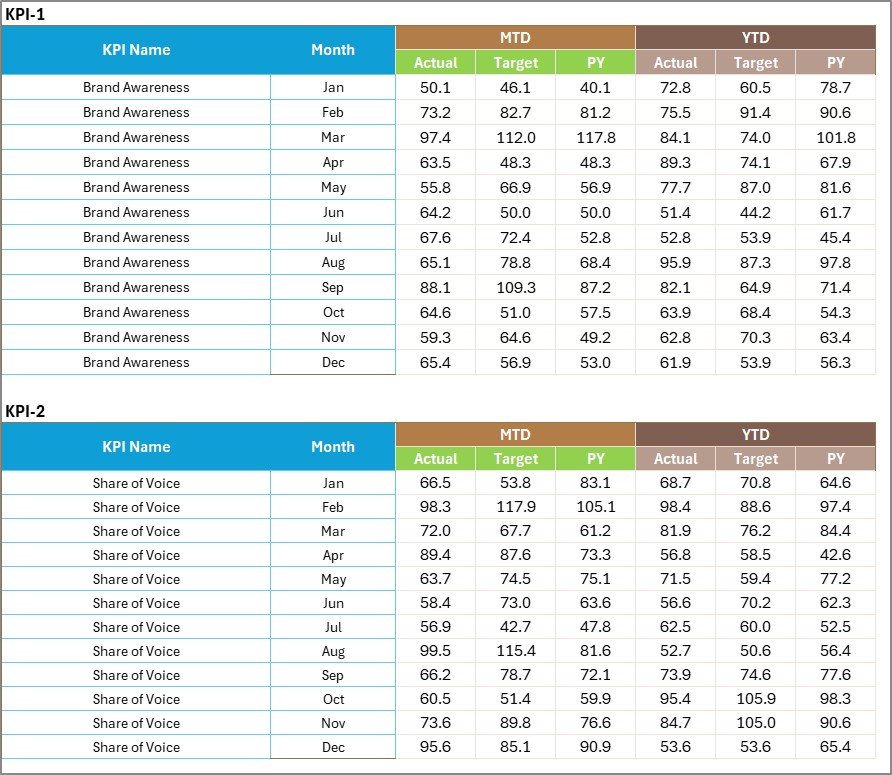
📋 3️⃣ Input Data Sheet – Data Management Hub
A simple and structured input area for your performance data.
-
Enter Actual, Target, and Previous Year values for each KPI.
-
Data auto-syncs with all visuals and dashboards.
-
Supports multiple departments (Sales, Marketing, Operations, Customer Service).
This ensures all reports stay accurate, consistent, and up-to-date.
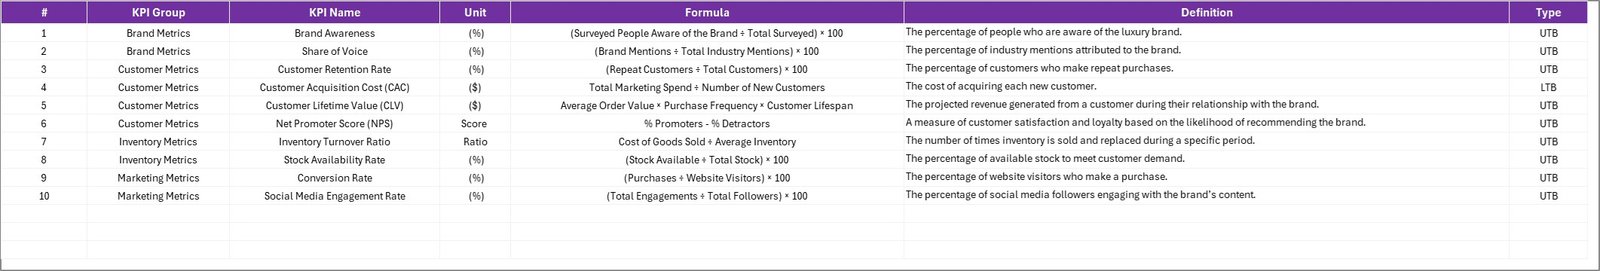
📘 4️⃣ KPI Definition Sheet – Reference & Standardization
Ensures every team member understands each KPI clearly.
Includes fields for:
-
KPI Name
-
Group
-
Unit
-
Formula
-
Definition
-
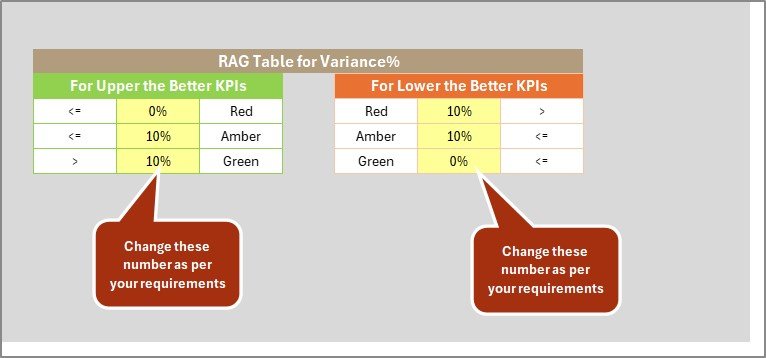
Type (Upper or Lower the Better)
By maintaining this sheet, luxury brands ensure transparency, clarity, and alignment across global teams.
💡 Examples of KPIs Tracked in the Luxury Industry
Sales & Revenue: Total Sales, Sales Growth %, Gross Profit Margin, Revenue per Store.
Customer Experience: Retention Rate, Repeat Purchase %, Net Promoter Score (NPS).
Marketing: Campaign ROI, Brand Engagement Rate, Customer Acquisition Cost.
Operations: Inventory Turnover, Stock-out Rate, Order Fulfillment Time.
Financials: Operating Profit Margin, Return on Assets (ROA), Return on Equity (ROE).
These KPIs deliver a holistic view of luxury business performance — from boutique experience to bottom-line profitability.
🌟 Advantages of the Luxury Goods KPI Scorecard in Excel
✅ All-in-One Dashboard – Consolidates sales, marketing, and customer KPIs in one place.
✅ Faster Decisions – Auto-updating visuals for real-time strategy refinement.
✅ Visual Simplicity – Clear color-coded design for executive-level clarity.
✅ Accountability – Assign KPIs by department for better ownership.
✅ Full Flexibility – Add new KPIs, adjust formulas, or expand categories easily.
✅ Cost-Efficient Solution – No expensive BI software required.
✅ Collaboration Ready – Share via email or cloud for team access.
🧠 Best Practices for Effective KPI Tracking
📌 Align KPIs with strategic objectives.
📌 Update data monthly to maintain accuracy.
📌 Validate data sources before inputting.
📌 Use consistent units and naming conventions.
📌 Focus on 10–15 key metrics for clarity.
📌 Review results quarterly to refine business goals.
📌 Keep visuals simple and meaningful.
👑 Who Can Benefit from This Scorecard
💼 Luxury Brand Managers – Track sales, quality, and customer loyalty.
🏬 Retail Executives – Monitor profitability and store performance.
📊 Data Analysts – Study trends across multiple product lines.
🧵 Fashion Houses & Boutiques – Measure market reach and client retention.
💎 Jewelry & Watch Brands – Evaluate high-ticket sales and conversion ratios.


Reviews
There are no reviews yet.