Managing logistics operations without clear visibility can quickly become overwhelming. Modern businesses handle shipments, transportation expenses, fuel costs, insurance charges, and delivery timelines across multiple regions every day. However, when logistics data is scattered across spreadsheets and reports, decision-making slows down and operational costs increase.
The Logistics Dashboard in Power BI is designed to solve this challenge by transforming complex logistics data into powerful, interactive insights. Instead of spending hours preparing reports, managers can instantly monitor logistics performance through dynamic visuals, KPI cards, and intelligent analytics.
This ready-to-use Power BI dashboard helps organizations track logistics costs, analyze delivery efficiency, monitor carrier performance, and identify improvement opportunities — all in one centralized platform.
Whether you manage supply chain operations, transportation planning, or logistics finance, this dashboard empowers you to make faster, data-driven decisions with confidence.
🚚 Key Feature of Logistics Dashboard in Power BI
The dashboard includes multiple analytical pages designed to provide complete logistics visibility.
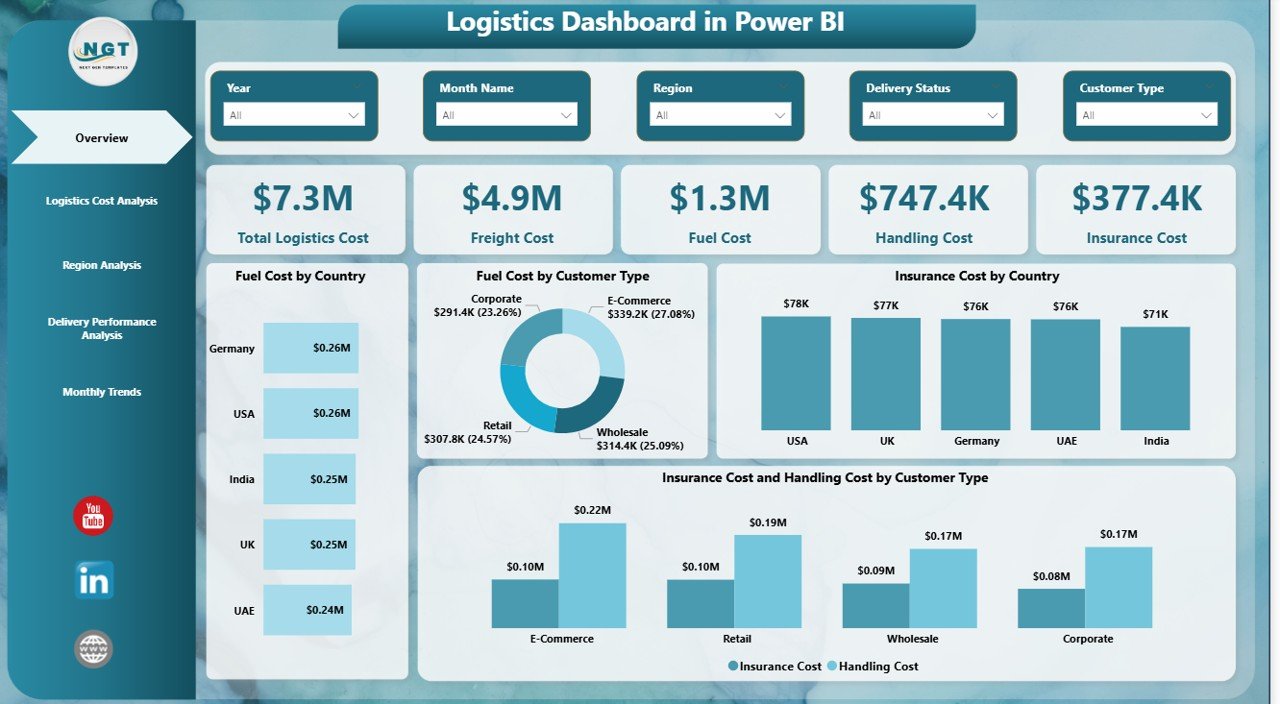
✅ Interactive KPI Cards showing Total Logistics Cost, Freight Cost, Fuel Cost, Handling Cost, and Insurance Cost
✅ Dynamic slicers for instant filtering by region, customer type, warehouse, and carrier
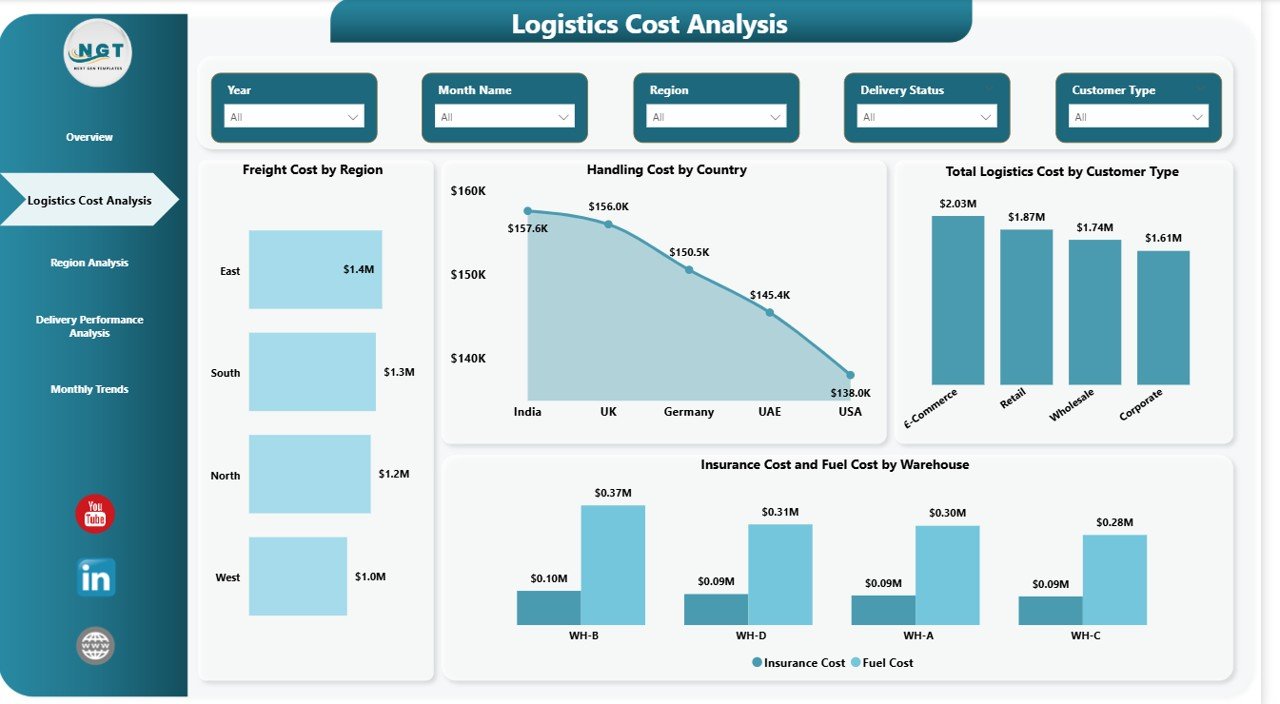
✅ Logistics Cost Analysis to identify high-cost operations
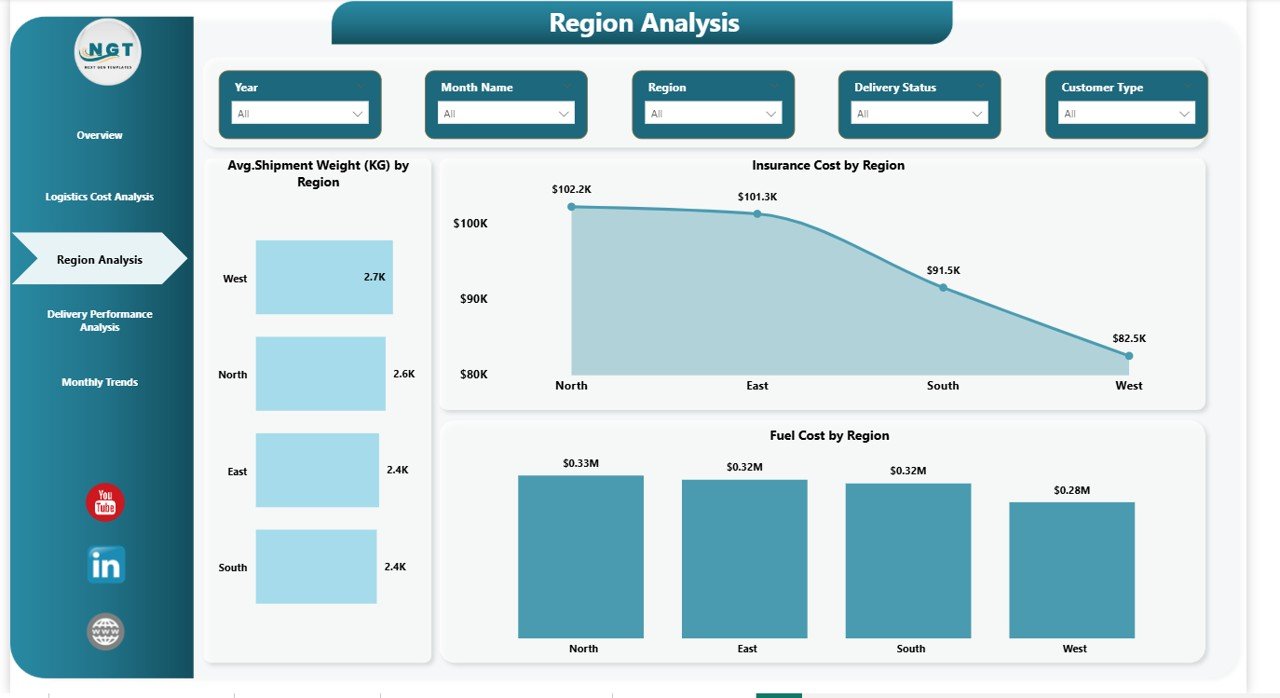
✅ Region Performance Insights for geographic comparison
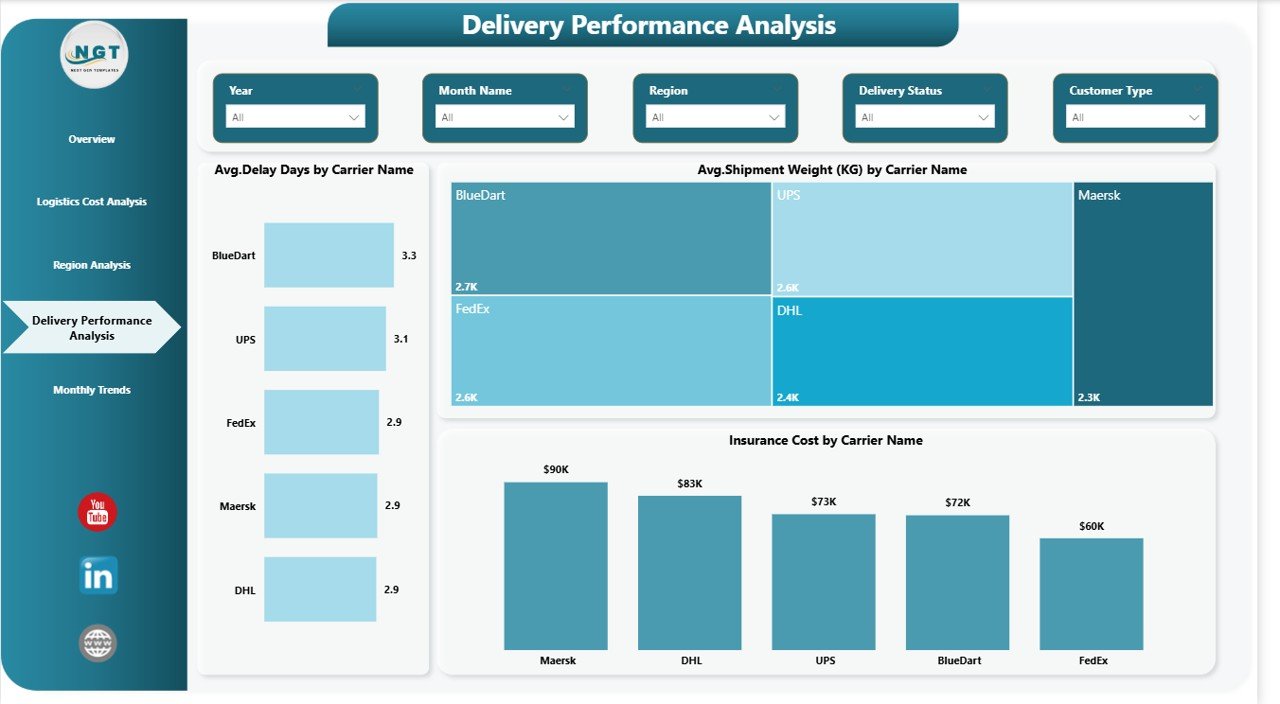
✅ Delivery Performance Monitoring with delay and carrier analysis
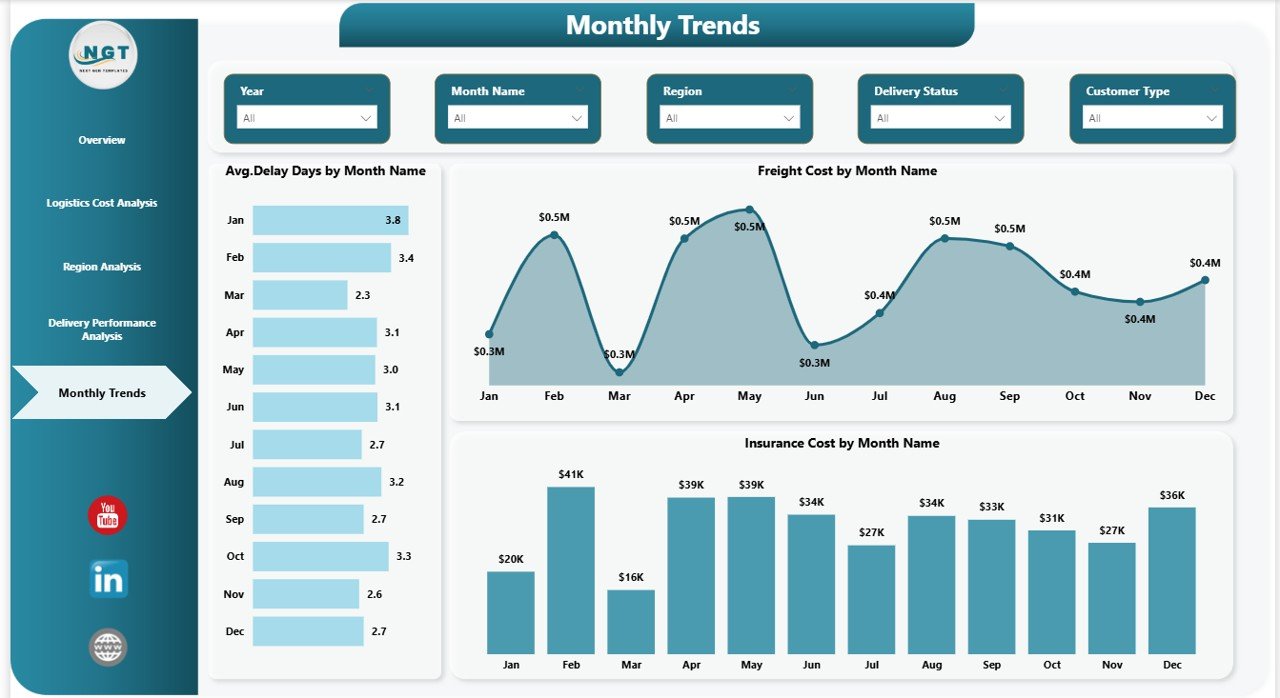
✅ Monthly Trend Analysis to track seasonal logistics patterns
✅ Real-time analytics powered by Power BI visuals
✅ Drill-down capability for deeper operational investigation
These features allow logistics teams to monitor performance without manual reporting.
📦 What’s Inside the Logistics Dashboard in Power BI
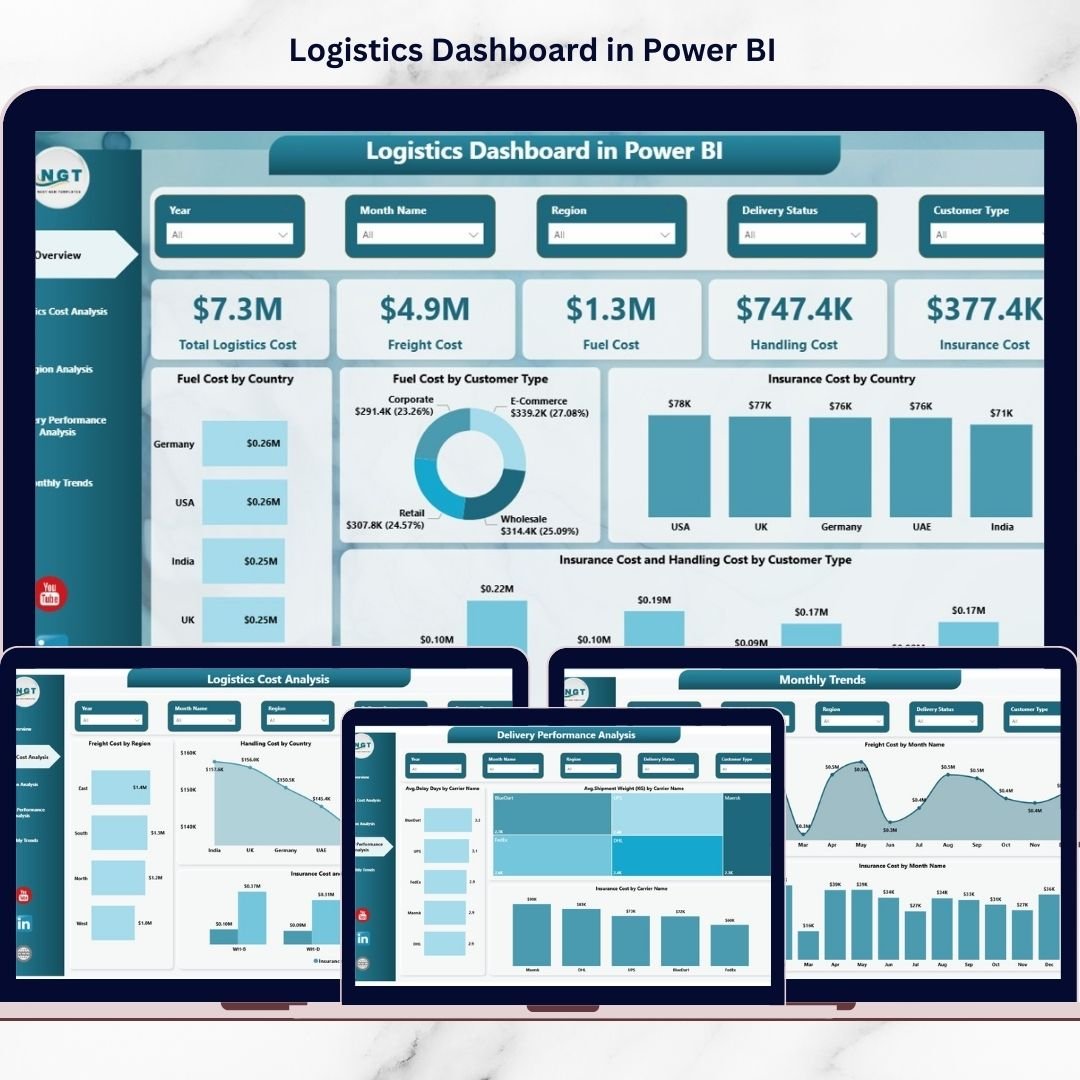
This digital product contains a professionally designed Power BI file structured into five analytical pages:
📊 Overview Dashboard – Central performance panel with KPI cards and cost visuals
📊 Logistics Cost Analysis – Detailed breakdown of freight, fuel, handling, and insurance expenses
📊 Region Analysis – Geographic logistics performance comparison
📊 Delivery Performance Analysis – Carrier efficiency and shipment delay insights
📊 Monthly Trends Page – Cost and delay tracking across months
The dashboard layout is clean, professional, and business-ready, making it suitable for immediate implementation.
⚙️ How to Use the Logistics Dashboard in Power BI
Getting started with the dashboard is simple and user-friendly:
1️⃣ Import your logistics dataset into Power BI
2️⃣ Replace sample data with your business data
3️⃣ Refresh the dashboard to update visuals automatically
4️⃣ Use slicers to filter by region, warehouse, or customer type
5️⃣ Monitor KPIs regularly to identify inefficiencies early
Even users with basic Power BI knowledge can operate the dashboard easily.
👨💼 Who Can Benefit from This Logistics Dashboard in Power BI
This dashboard is ideal for professionals and organizations managing logistics operations:
✅ Supply Chain Managers
✅ Logistics Coordinators
✅ Warehouse Managers
✅ Transportation & Fleet Teams
✅ Operations Managers
✅ Finance & Cost Analysts
Industries that benefit include manufacturing, retail, e-commerce, FMCG, distribution companies, and third-party logistics providers.
By using this dashboard, businesses gain better cost control, improved delivery performance, and stronger operational planning.
A well-designed logistics analytics system turns raw operational data into strategic intelligence. Instead of reacting to problems late, organizations can proactively optimize routes, control expenses, and improve customer satisfaction.
The Logistics Dashboard in Power BI helps companies move from manual reporting to intelligent decision-making — giving leaders complete visibility into logistics performance anytime, anywhere.
Click hare to read the Detailed blog post
Watch the step-by-step video tutorial:


