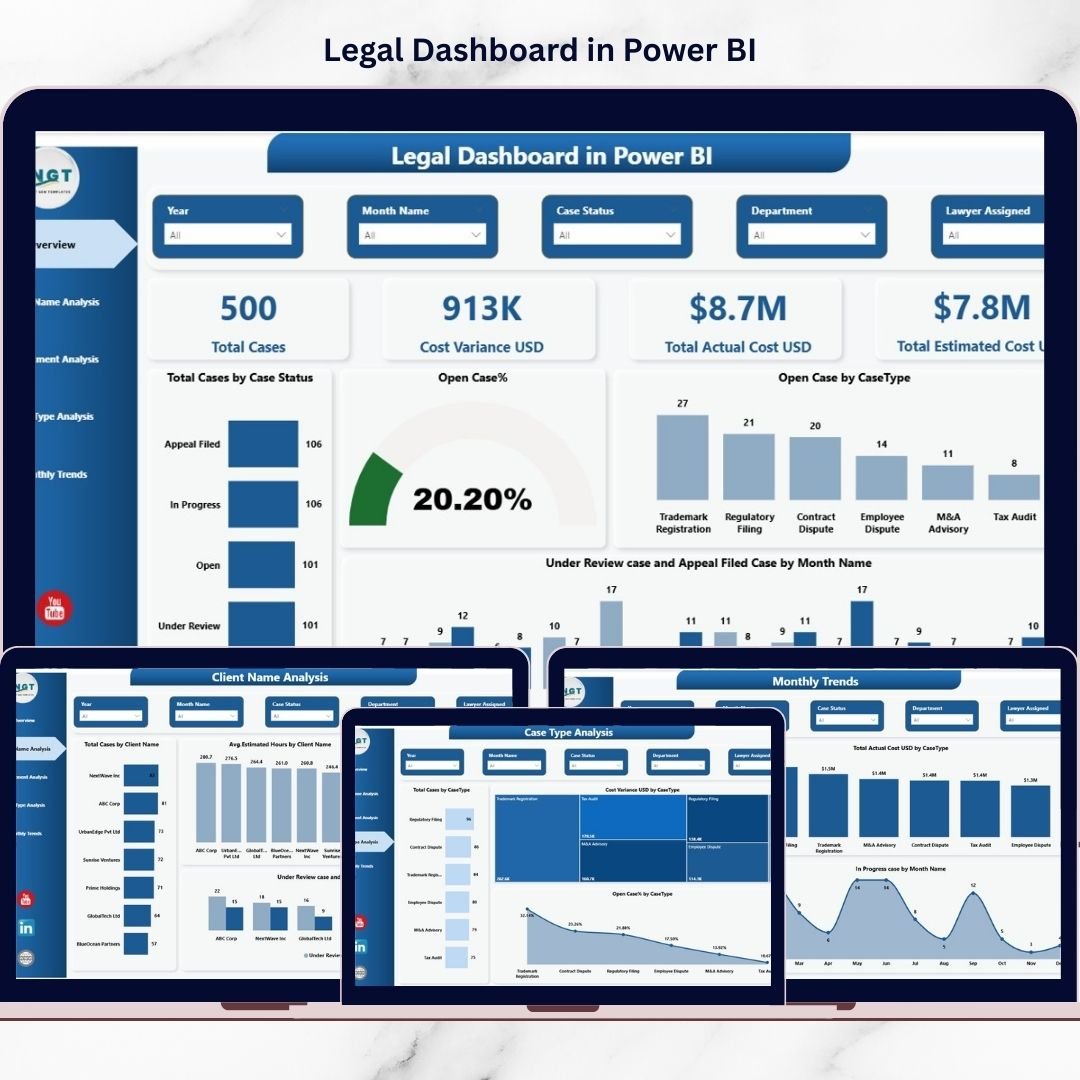
Managing legal operations using spreadsheets and disconnected reports is no longer practical in today’s fast-paced business environment. Law firms and corporate legal departments handle multiple cases, clients, and cost structures simultaneously. Without a centralized system, tracking performance, monitoring expenses, and evaluating case progress becomes complex and time-consuming.That is exactly where the Legal Dashboard in Power BI becomes a game-changing solution.This ready-to-use interactive dashboard transforms complex legal data into clear visual insights. Instead of manually reviewing reports, legal professionals can monitor KPIs, analyze costs, and evaluate performance instantly using dynamic analytics powered by Microsoft Power BI.
The dashboard helps organizations gain complete visibility into legal operations while improving decision-making speed and operational transparency. Whether you manage litigation, compliance cases, or corporate legal matters, this dashboard provides structured analytics to support smarter legal management.
## ⚖️ Key Feature of Legal Dashboard in Power BI
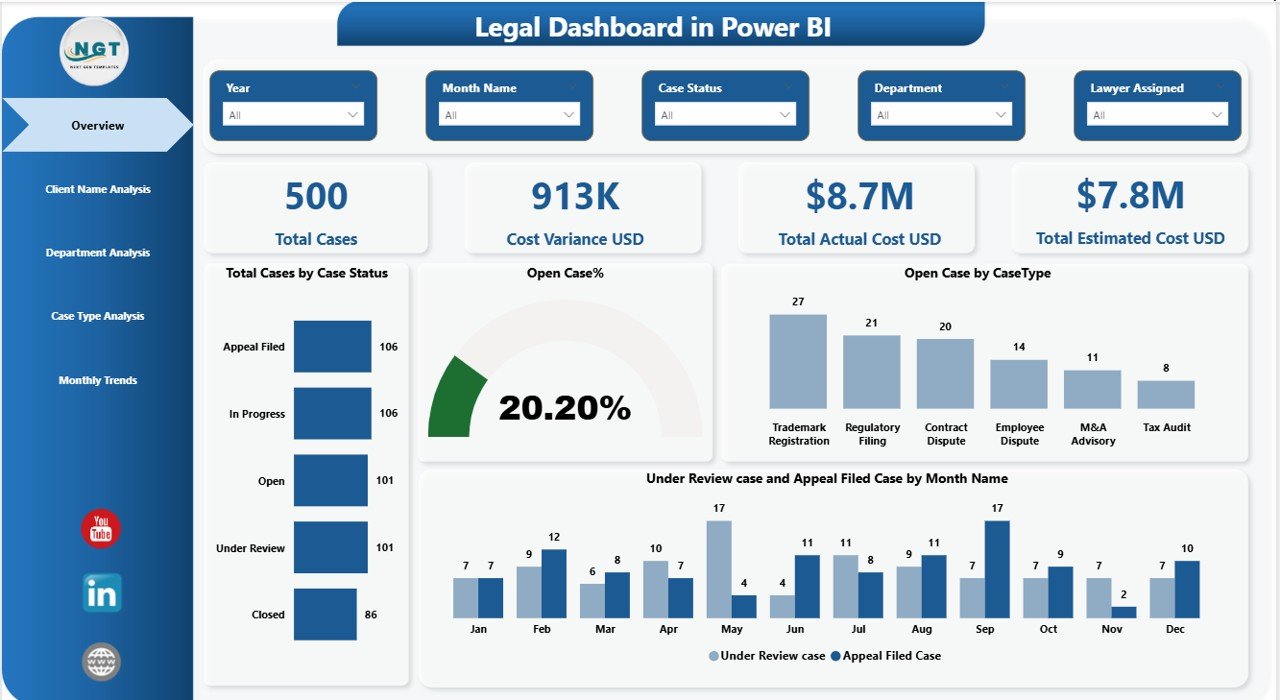
✅ Interactive Overview Page – Instantly view Total Cases, Cost Variance, Actual Cost, and Estimated Cost in one centralized control panel.
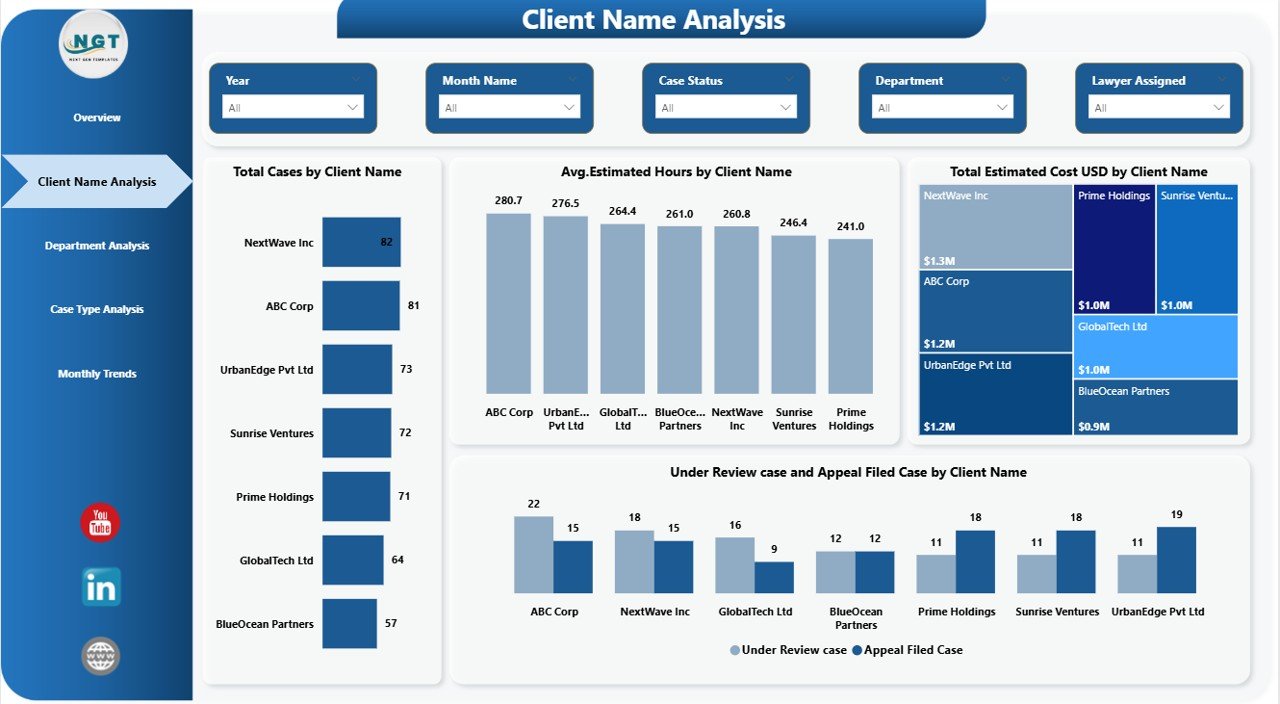
✅ Client Performance Analysis – Identify high-value and resource-intensive clients through detailed visual insights.
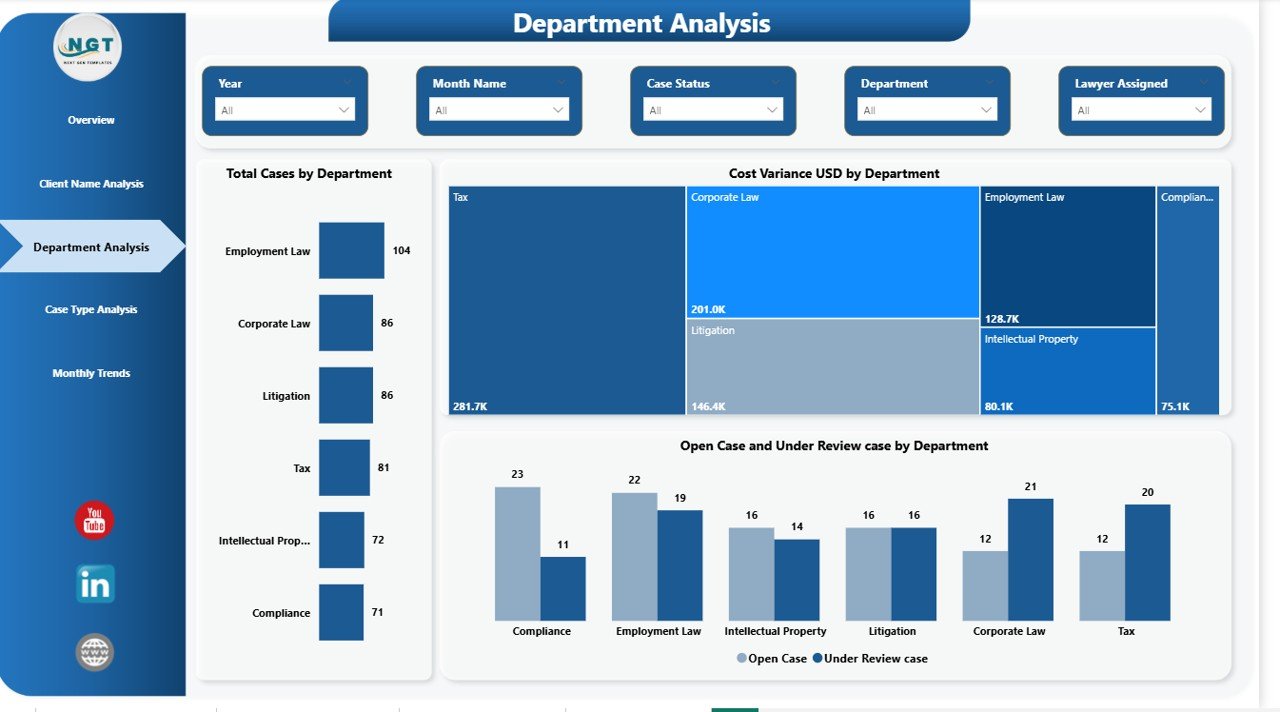
✅ Department Performance Tracking – Monitor workload distribution, open cases, and cost variance across departments.
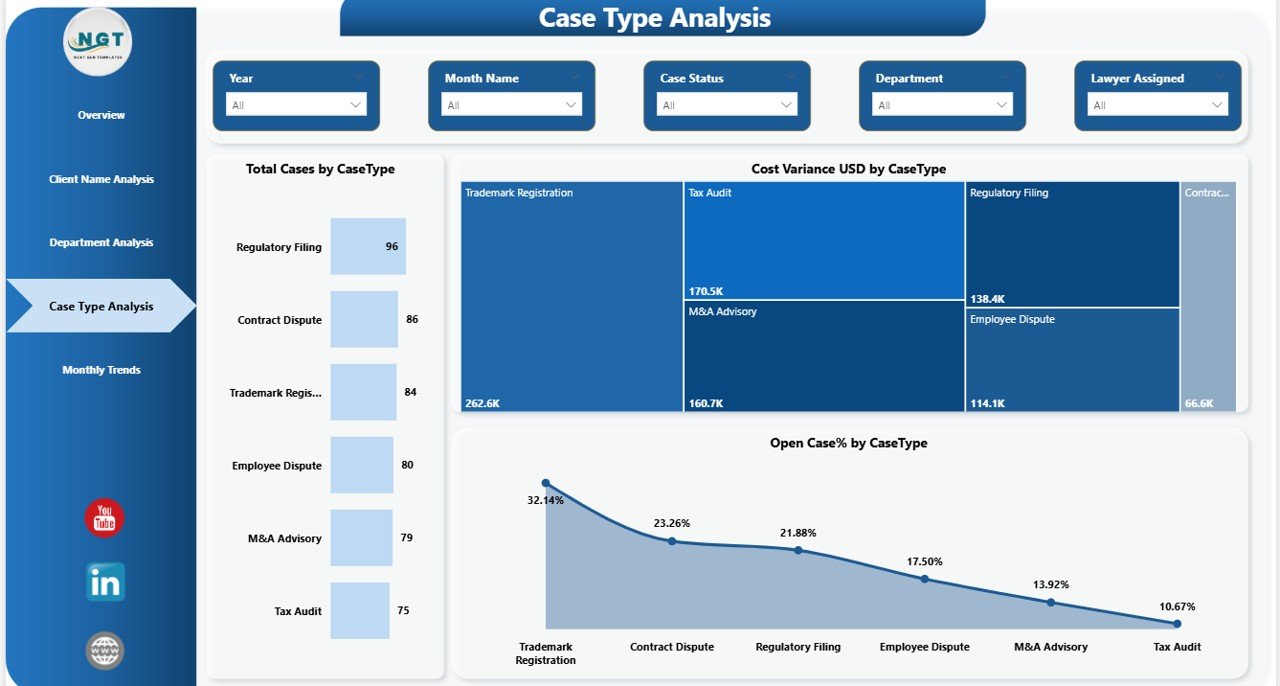
✅ Case Type Intelligence – Understand which legal case categories consume the most time and budget.
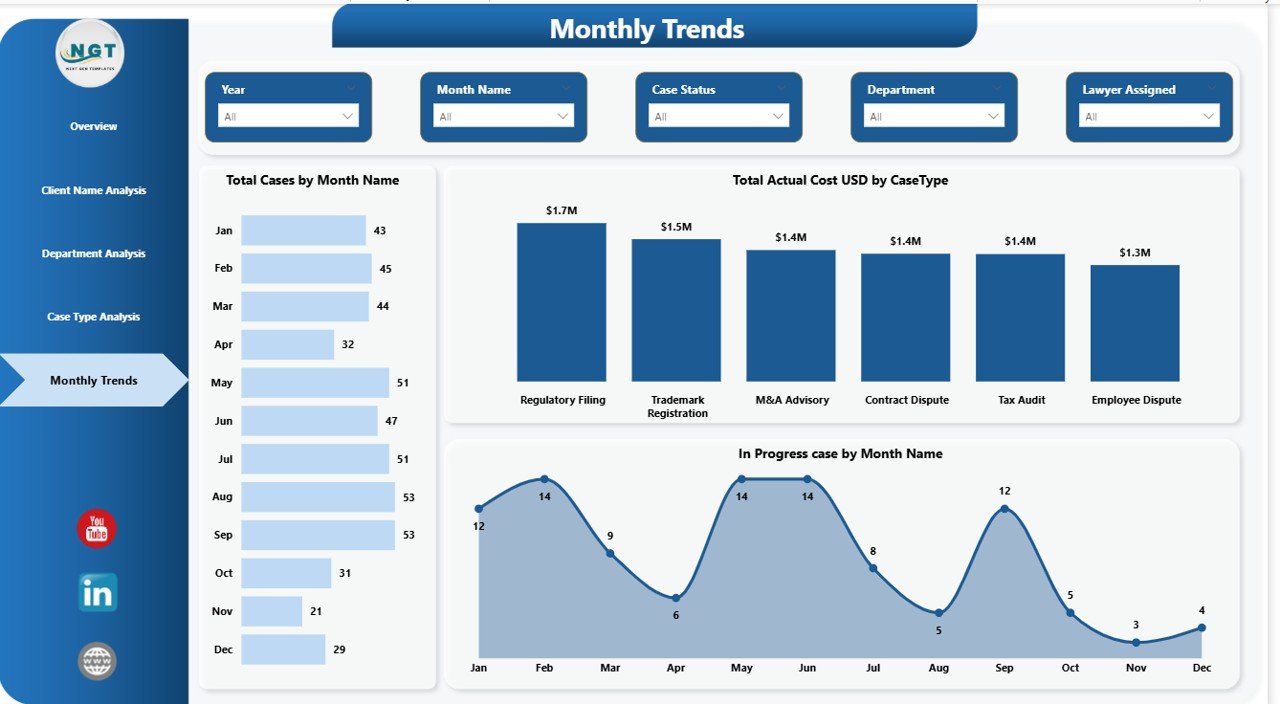
✅ Monthly Trend Analysis – Track legal workload and expenses over time for accurate forecasting.
✅ Dynamic Slicers & Filters – Analyze data instantly based on department, client, case type, or time period.
✅ Professional Visualizations – Clean charts and KPI cards simplify complex legal information.
✅ Real-Time Analytics Capability – Make faster decisions using updated and interactive reports.
## 📦 What’s Inside the Legal Dashboard in Power BI
When you download this product, you receive a professionally designed Power BI dashboard file structured for real-world legal analytics.
Inside the dashboard:
-
Five fully interactive dashboard pages
-
KPI cards for performance monitoring
-
Case status and workload visualizations
-
Cost variance and budgeting analysis
-
Client-wise and department-wise analytics
-
Monthly trend tracking visuals
-
Ready-to-use professional layout
-
Easy customization for your organization
The dashboard is built using best practices so users can immediately start analyzing legal data without building reports from scratch.
## 🛠️ How to Use the Legal Dashboard in Power BI
Using this dashboard is simple, even for non-technical users.
1️⃣ Import your legal case data into Power BI.
2️⃣ Update or connect your dataset easily.
3️⃣ Use slicers to filter analysis dynamically.
4️⃣ Monitor KPI cards for daily performance tracking.
5️⃣ Analyze trends weekly or monthly.
6️⃣ Share insights with stakeholders for strategic decisions.
Because the dashboard uses intuitive visuals, teams quickly understand performance without extensive training.
## 👥 Who Can Benefit from This Legal Dashboard in Power BI
This dashboard is designed for professionals who require structured legal analytics and operational clarity.
Ideal users include:
-
Corporate Legal Departments
-
Law Firms & Legal Consultants
-
Compliance & Risk Management Teams
-
Legal Operations Managers
-
Finance Controllers monitoring legal costs
-
Executive Leadership Teams
-
Business Analysts handling legal reporting
Whether your organization manages dozens or thousands of cases, this dashboard helps streamline analysis and improve accountability.
The Legal Dashboard in Power BI eliminates reporting confusion by combining automation, visualization, and performance monitoring into one powerful solution. Instead of relying on manual spreadsheets, organizations gain actionable intelligence that improves cost control, resource planning, and legal outcomes.
If you want faster reporting, better transparency, and smarter legal decisions — this dashboard delivers exactly that.
Click hare to read the Detailed blog post
Watch the step-by-step video tutorial:


