Running a leather processing business without clear performance visibility is like operating a factory in the dark. From soaking and tanning to dyeing and finishing, every stage impacts cost, efficiency, and product quality. Even small inefficiencies can lead to production delays, increased waste, and reduced profitability.
That’s why modern leather manufacturers are shifting toward data-driven performance monitoring.
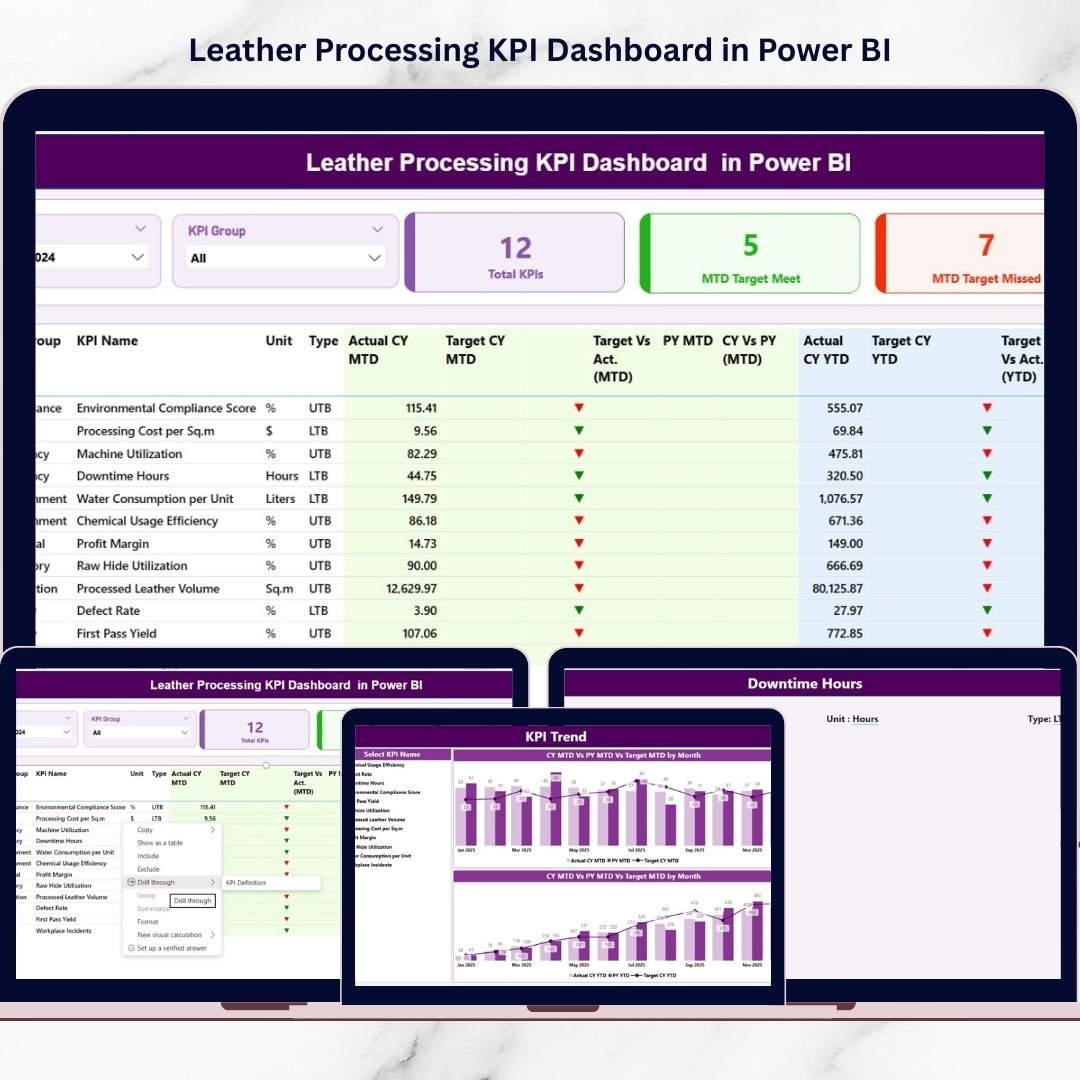
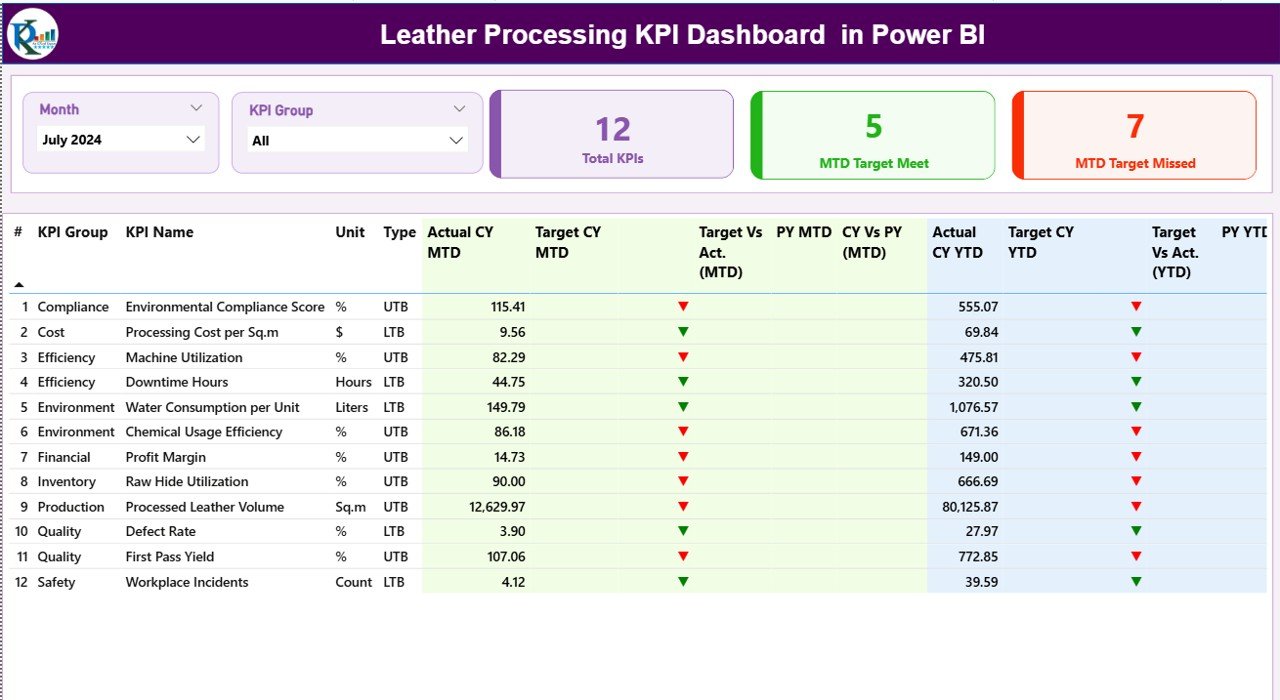
The Leather Processing KPI Dashboard in Power BI is a powerful, ready-to-use analytics solution designed to transform raw operational data into clear, interactive insights. Instead of managing scattered spreadsheets or manual reports, this dashboard allows you to monitor production, quality, cost, and efficiency KPIs from one centralized system.
Built using Power BI visualization with Excel-based data input, the dashboard automatically compares Actual vs Target performance, Current Year vs Previous Year results, and MTD/YTD progress — helping decision-makers take faster and smarter actions.
Whether you manage a tannery, leather finishing plant, or multi-stage processing unit, this dashboard gives you complete operational clarity in minutes.
⭐ Key Features of Leather Processing KPI Dashboard in Power BI
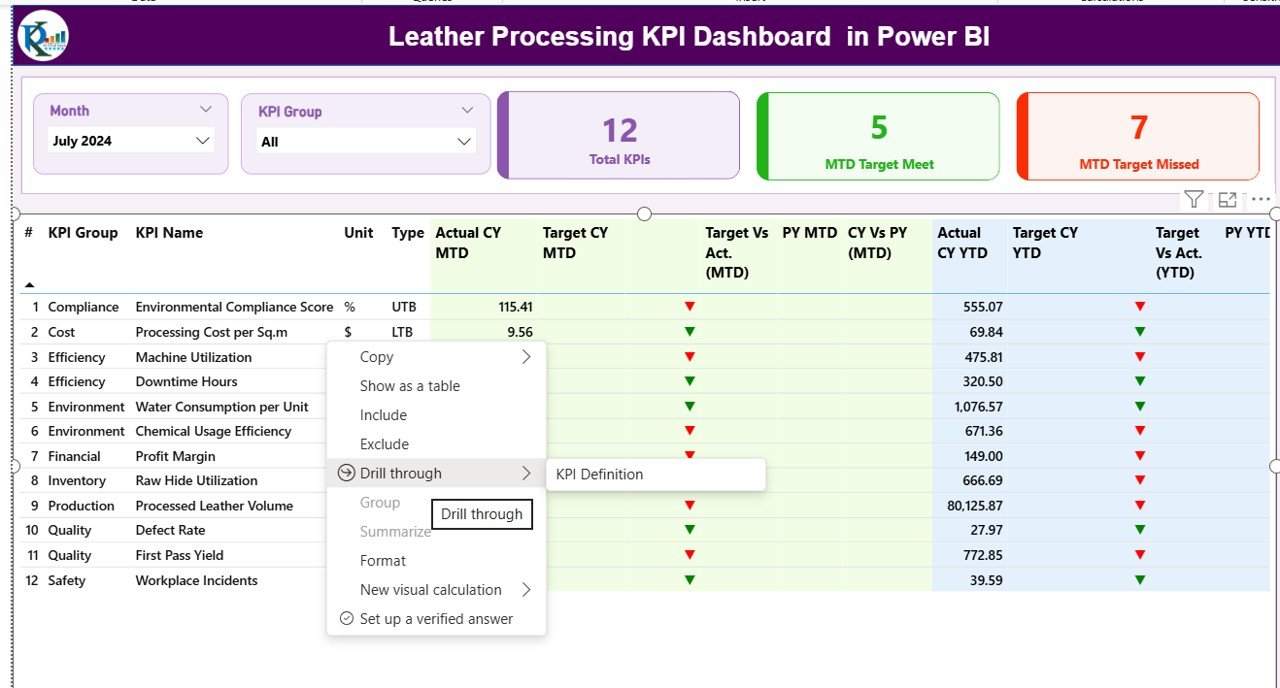
✅ Interactive KPI Summary Dashboard – Instantly view performance health using KPI cards and structured tables.
📊 MTD & YTD Performance Tracking – Monitor short-term and long-term performance simultaneously.
🎯 Actual vs Target Comparison – Identify underperforming KPIs quickly using visual indicators.
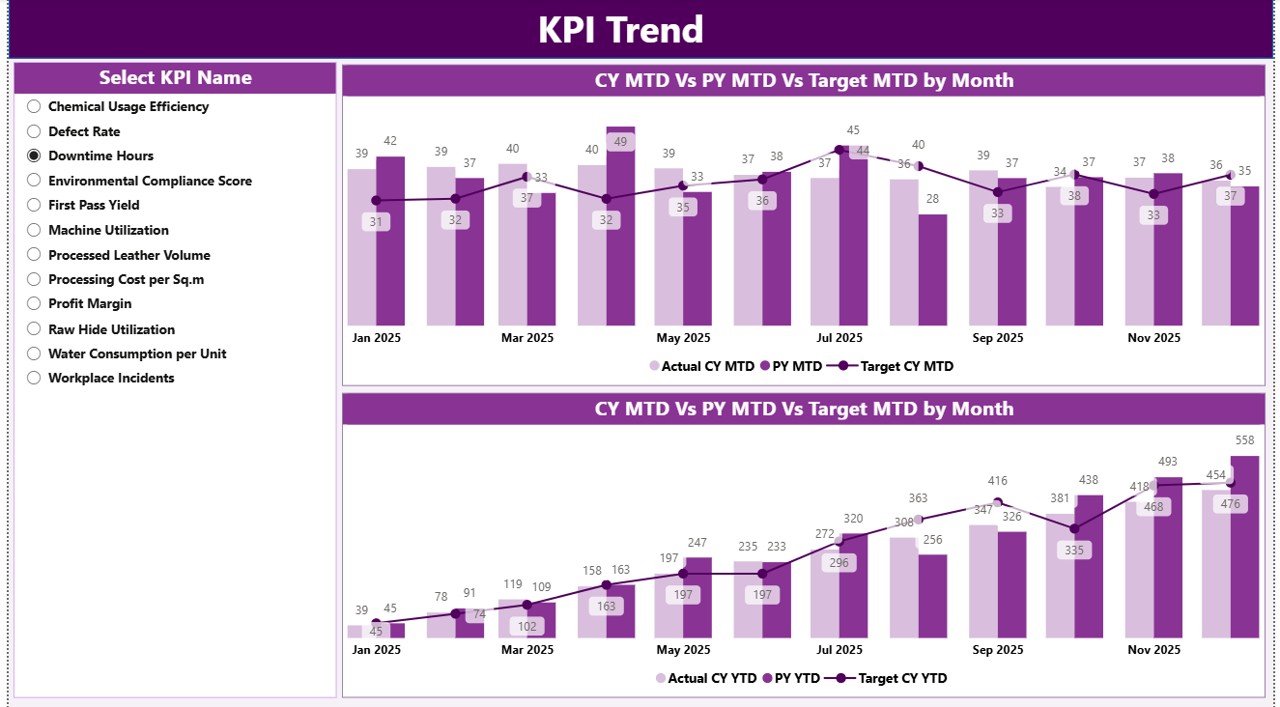
📈 Trend Analysis Charts – Analyze performance improvement or decline over time.
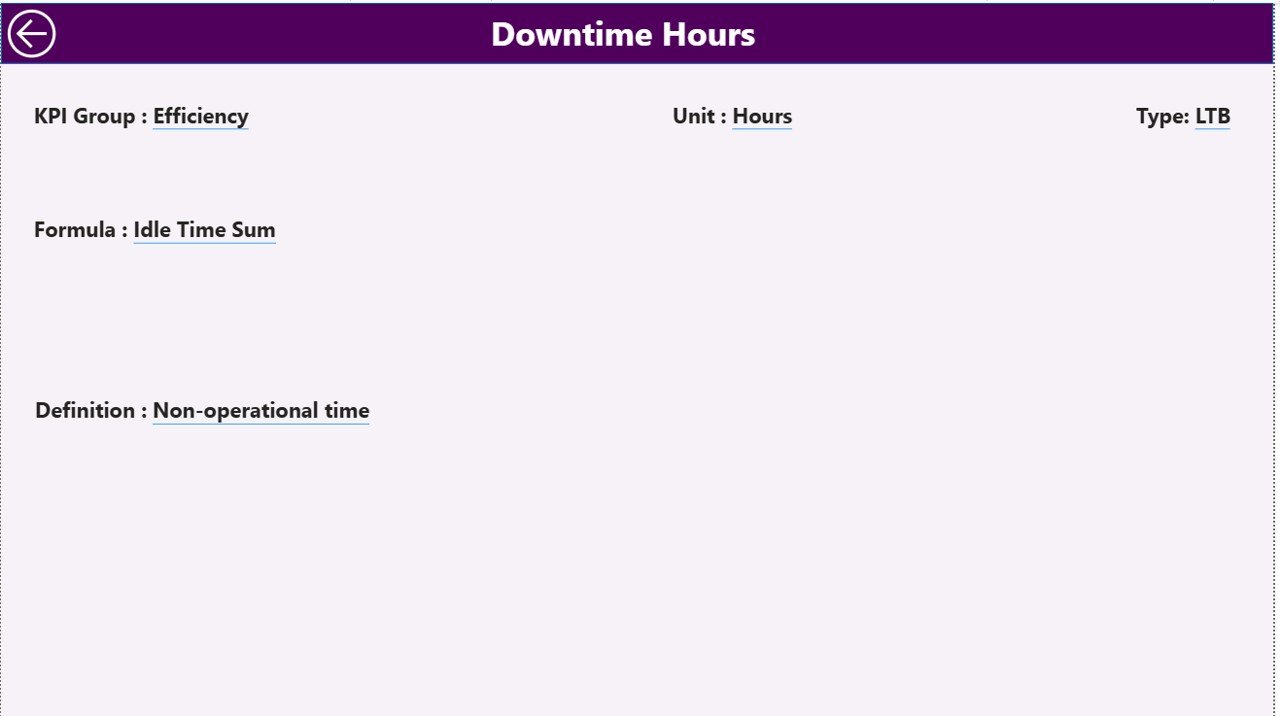
🔍 Drill-Through KPI Definitions – Click any KPI to understand formulas and measurement logic.
🧩 Dynamic Slicers & Filters – Filter by month or KPI group for focused analysis.
⚡ Automatic Calculations – Reduce manual reporting effort with prebuilt measures.
📂 Excel Integration – Simple data entry without complex systems.
🏭 Manufacturing-Focused KPIs – Designed specifically for leather processing operations.
📦 What’s Inside the Leather Processing KPI Dashboard in Power BI
When you download this product, you receive a professionally structured analytical system including:
✔ Power BI Dashboard File (.PBIX)
✔ Structured Excel Data Source Template
✔ KPI Definition Framework
✔ Actual & Target Input Sheets
✔ Prebuilt MTD & YTD Calculations
✔ Interactive Summary Page
✔ KPI Trend Analysis Page
✔ KPI Definition Drill-Through Page
Everything is preconfigured — simply update your data and start analyzing instantly.
🛠️ How to Use the Leather Processing KPI Dashboard in Power BI
Using the dashboard is simple and beginner-friendly:
1️⃣ Enter monthly KPI values in Excel sheets.
2️⃣ Update Actual and Target performance data.
3️⃣ Open the Power BI dashboard file.
4️⃣ Refresh data with one click.
5️⃣ Use slicers to analyze KPIs by period or category.
The dashboard automatically updates visuals, comparisons, and performance indicators — no advanced coding required.
🎯 Who Can Benefit from This Leather Processing KPI Dashboard
This dashboard is ideal for professionals and organizations such as:
👨🏭 Leather Processing Plant Managers
📊 Production & Operations Teams
✅ Quality Control Departments
💰 Cost & Efficiency Analysts
🏢 Manufacturing Executives
📈 Business Performance Analysts
🌍 Leather Export Companies
If your organization wants structured KPI monitoring and faster decision-making, this solution is built for you.
By combining Excel simplicity with Power BI analytics, this dashboard transforms complex manufacturing data into actionable intelligence. Managers can quickly detect inefficiencies, monitor quality trends, and improve operational performance without spending hours preparing reports.
Instead of reactive management, your business moves toward proactive performance control.
As competition grows and efficiency becomes critical, adopting a KPI-driven system is no longer optional — it is essential for sustainable manufacturing success.
Click here to read the Detailed blog post
Watch the step-by-step video tutorial:


