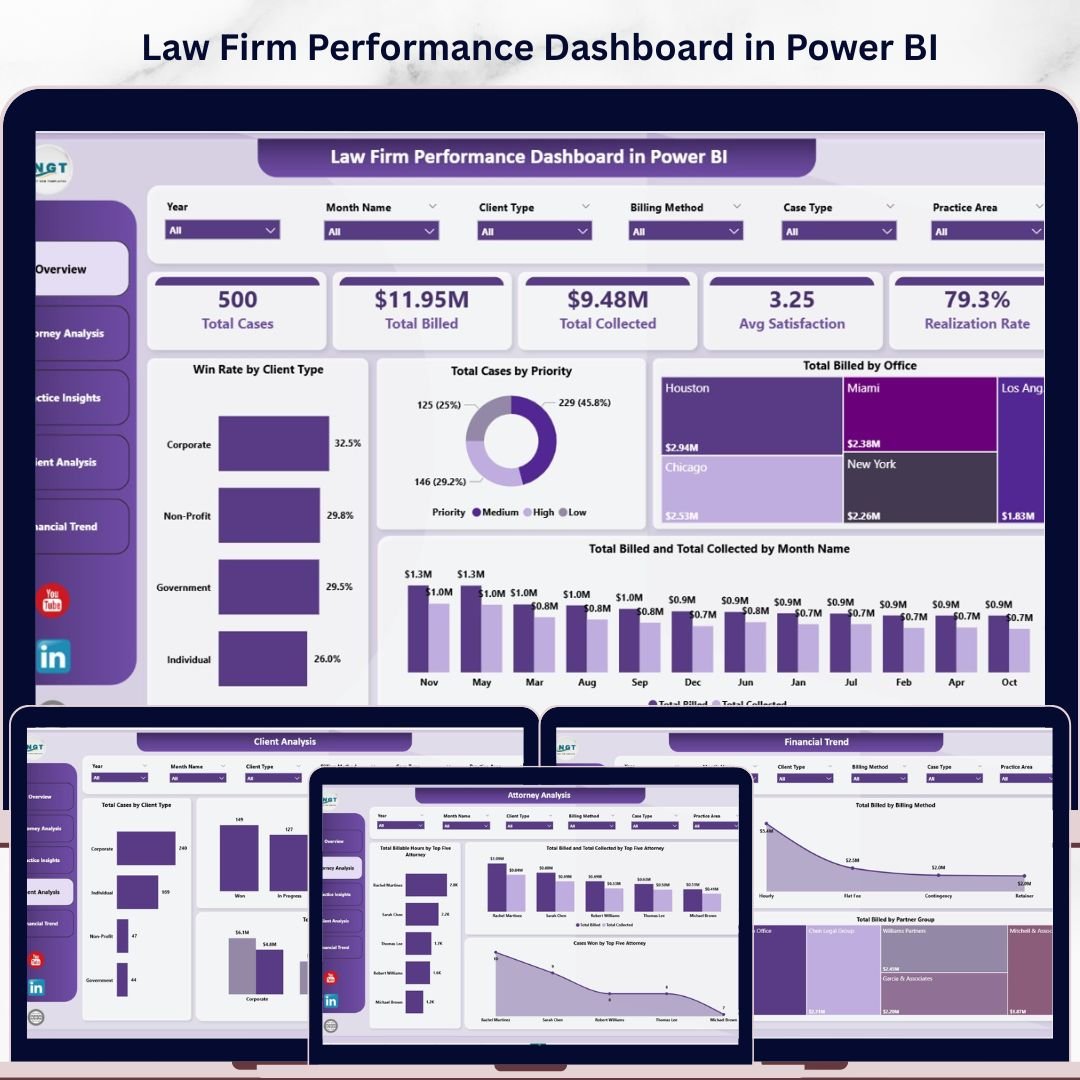

🔑 Key Features of Law Firm Performance Dashboard in Power BI
Law Firm Performance Dashboard in Power BI is a ready-to-use business intelligence template designed for law firms, corporate legal departments, and solo practitioners who need complete visibility into billing, collections, attorney performance, and financial trends. This Power BI dashboard includes 5 interactive pages — Overview, Attorney Analysis, Practice Insights, Client Analysis, and Financial Trend — covering every critical dimension of law firm operations. It tracks essential KPIs such as Total Cases, Total Billed, Total Collected, Average Satisfaction Score, and Realization Rate. Built with interactive Power BI visuals and slicers, every chart updates dynamically when you apply filters or connect your own data source.
Whether you manage a boutique litigation firm or a full-service corporate law practice, this template gives you instant visibility into case performance, billing trends, and attorney productivity. Explore our complete collection of Power BI Dashboard Templates for more business intelligence solutions.
📦 What’s Inside the Law Firm Performance Dashboard in Power BI
📌 Overview Page — High-level KPI cards displaying Total Cases, Total Billed, Total Collected, Avg Satisfaction, and Realization Rate. Interactive visuals include Win Rate by Client Type, Total Cases by Priority, Total Billed by Office, and Total Billed and Total Collected by Month Name. Multiple slicers let you filter the entire dashboard instantly by office, client type, priority, or time period.
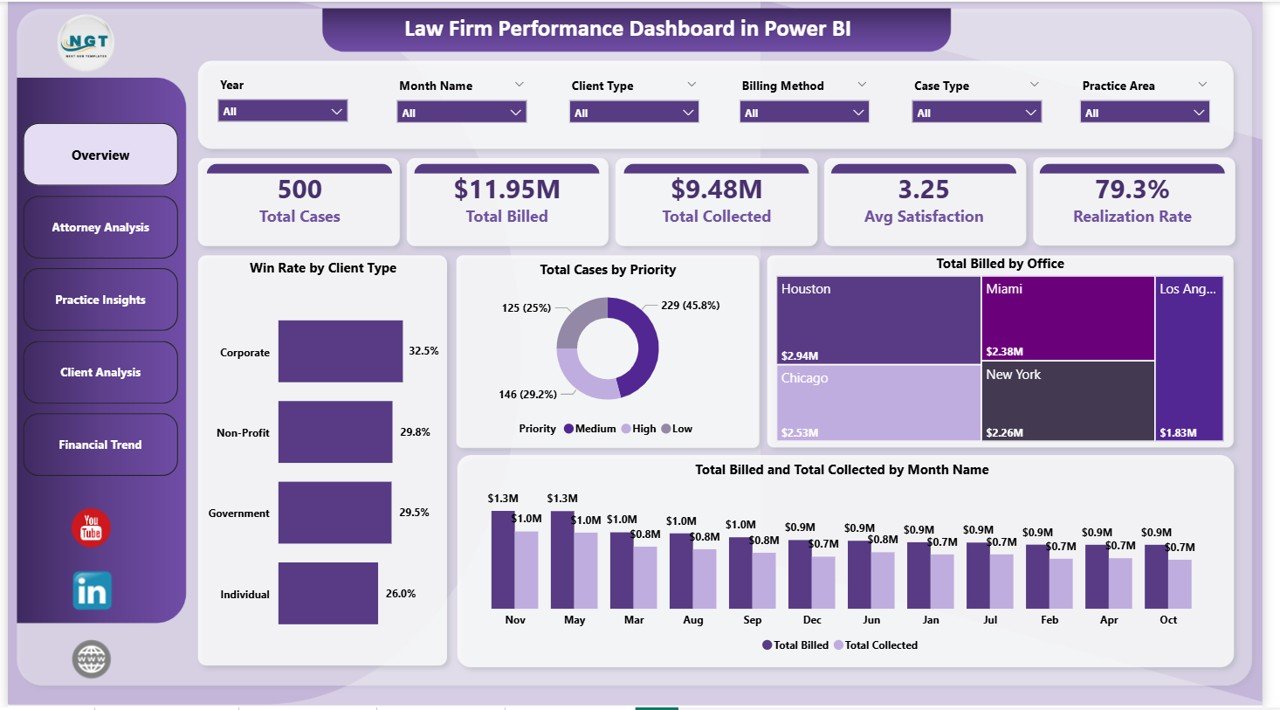 Law Firm Performance Dashboard in Power BI
📌 Attorney Analysis Page — Deep-dive into attorney-level performance with visuals showing Total Billable Hours by Top Five Attorney, Total Billed and Total Collected by Top Five Attorney, and Cases Won by Top Five Attorney. This page is ideal for evaluating partner and associate productivity across the firm.
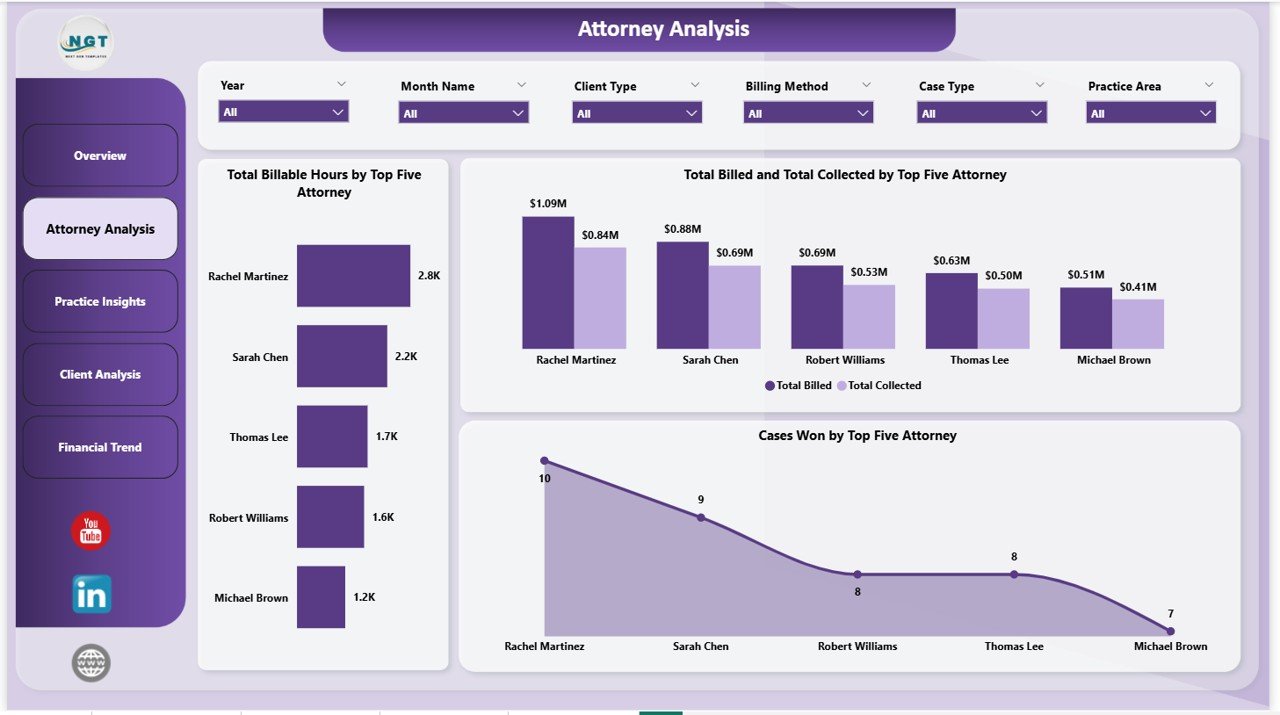 Attorney Analysis
📌 Practice Insights Page — Analyze your practice areas and billing methods through Total Cases by Billing Method, Total Billed by Practice Area, and Total Billed by Case Type. Understand which practice areas generate the most revenue and which billing methods drive collections.
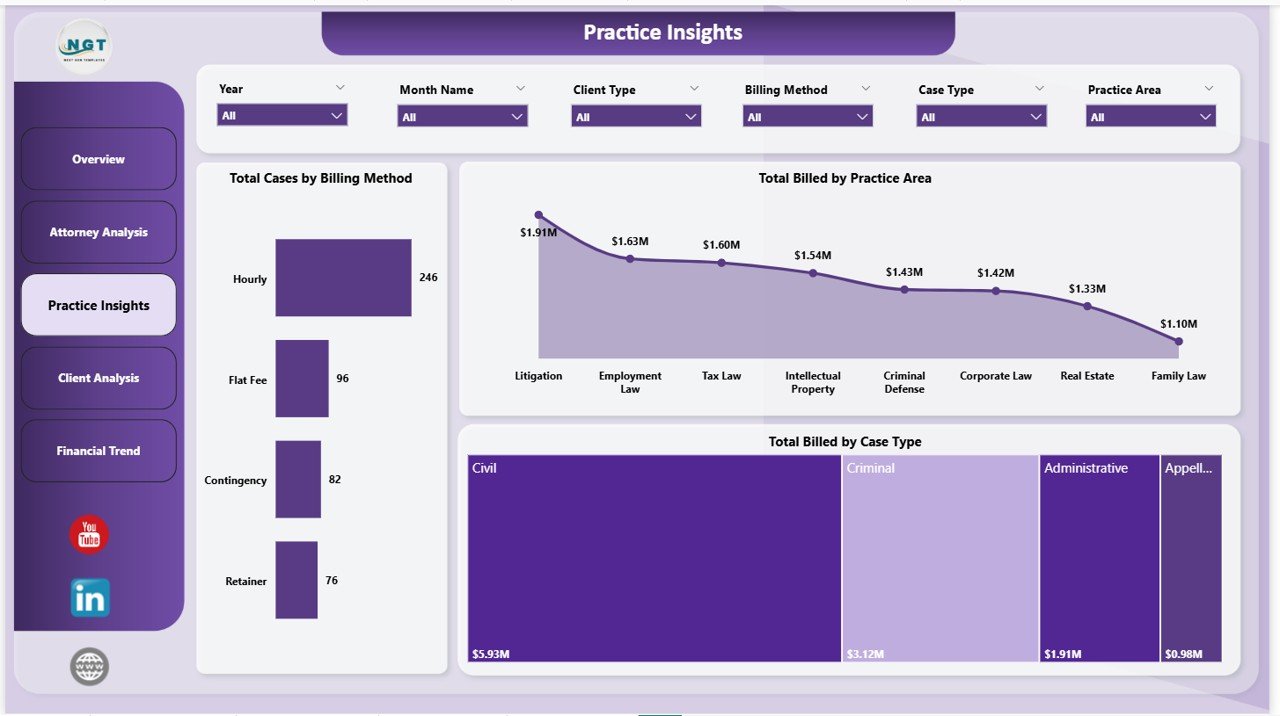 Practice Insights
📌 Client Analysis Page — Understand your client base with Total Cases by Client Type, Total Cases by Case Status, and Total Billed and Total Collected by Client Type. Track which client segments drive the highest billing volume and collection rates.
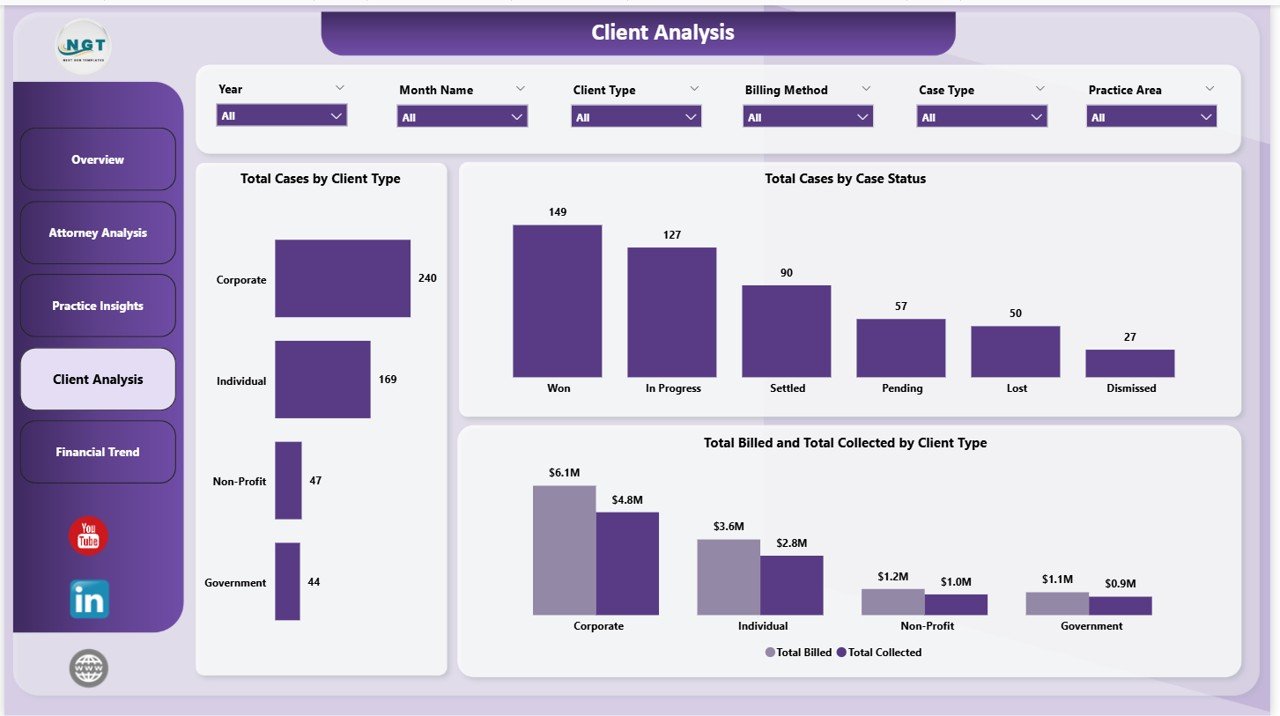 Client Analysis
📌 Financial Trend Page — Monitor financial patterns with Total Expenses by Month Name, Total Billed by Billing Method, and Total Billed by Partner Group. Spot billing trends and expense patterns over time to optimize firm profitability.
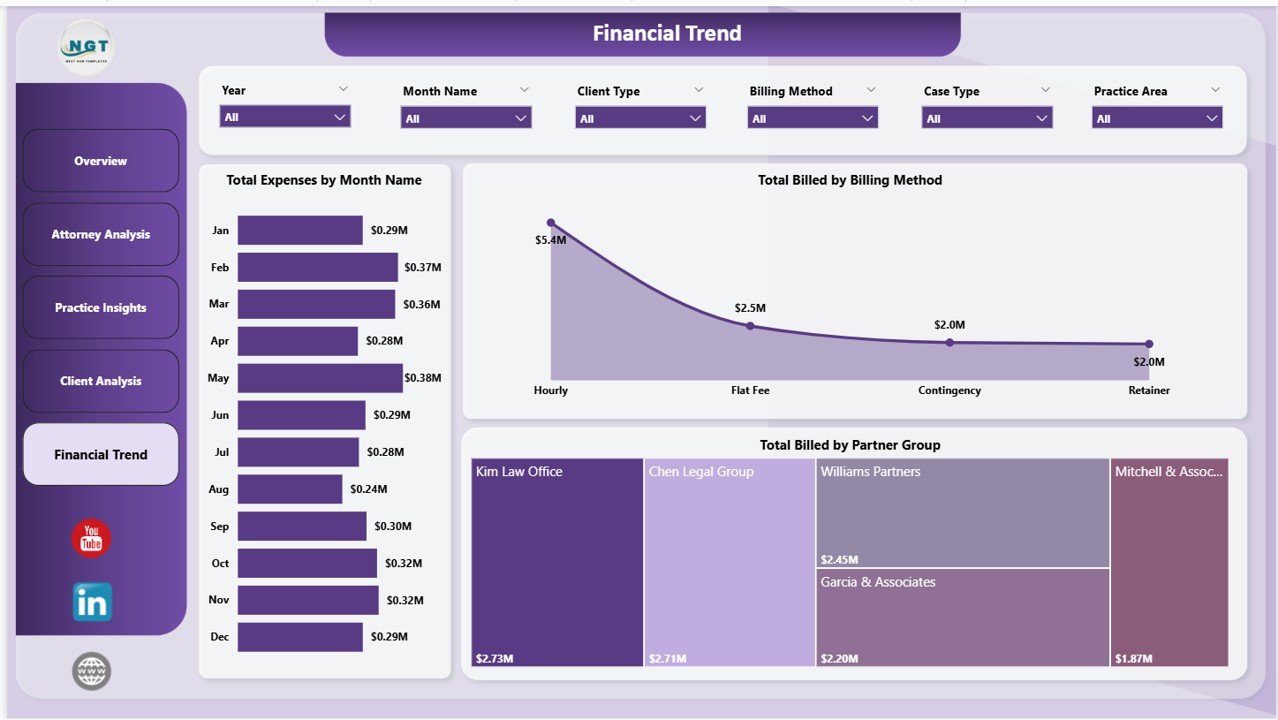 Financial Trend
Looking for this dashboard in other platforms? Check out the Law Firm Performance Dashboard in Excel or the Legal Dashboard in Google Sheets.
⚙️ How to Use the Law Firm Performance Dashboard in Power BI
1️⃣ Download and unzip the file, then open the .pbix file in Power BI Desktop (free from Microsoft).
2️⃣ Explore the sample data to understand the dashboard structure and all five analytical pages.
3️⃣ Replace the sample data source with your own law firm case records using Power Query Editor.
4️⃣ Use the slicers on each page to filter by office, client type, priority, billing method, or time period.
5️⃣ Review each analysis page — Attorney Analysis, Practice Insights, Client Analysis, and Financial Trend — for detailed breakdowns of firm performance.
6️⃣ Publish to Power BI Service for team-wide access and schedule automatic data refresh.
👥 Who Can Benefit from This Law Firm Performance Dashboard in Power BI
📌 Managing partners tracking firm-wide billing and collection performance across offices and practice areas
📌 Law firm administrators monitoring attorney productivity, billable hours, and client satisfaction metrics
📌 Solo practitioners analyzing case profitability, realization rates, and billing method effectiveness
📌 Legal operations managers evaluating practice area revenue and monthly expense patterns
📌 Finance teams in corporate legal departments tracking billing trends and cost optimization opportunities
📌 Legal consultants providing performance reports and benchmarking analysis to law firm clients
Also explore the Arbitration and Mediation Dashboard in Power BI and Legal Dashboard in Power BI for related legal analytics.
❓ Frequently Asked Questions
What KPIs does the Law Firm Performance Dashboard in Power BI track?
The Law Firm Performance Dashboard in Power BI tracks 5 key performance indicators on the overview page: Total Cases, Total Billed, Total Collected, Average Satisfaction Score, and Realization Rate percentage. Additional analysis pages provide breakdowns by attorney, practice area, client type, billing method, and monthly financial trends.
Do I need advanced Power BI skills to use this law firm dashboard?
No. The dashboard comes pre-built with all visuals, slicers, and data connections configured. Simply replace the sample data with your own law firm records using Power Query, and all charts update automatically without any DAX editing required.
Can I filter the dashboard by specific offices or client types?
Yes. Every page includes interactive slicers that let you filter the entire dashboard by office location, client type, case priority, billing method, and time period. The filtered view applies instantly across all visuals on that page.
How many dashboard pages are included in this template?
This template includes 5 interactive dashboard pages — Overview, Attorney Analysis, Practice Insights, Client Analysis, and Financial Trend — each designed to provide focused insights into different aspects of law firm operations and performance.
Is this template available in Excel or Google Sheets?
Yes. NextGenTemplates offers the Law Firm Performance Dashboard in Excel as well. For a Google Sheets alternative, check out the Legal Dashboard in Google Sheets on our website.
What is the best Power BI template for tracking law firm performance?
The Law Firm Performance Dashboard in Power BI from NextGen Templates is one of the most comprehensive options available. It covers billing, collections, attorney productivity, practice area revenue, client analysis, and financial trends across 5 interactive pages with dynamic slicers and drill-through capabilities.
🔗 Explore Related Templates
📌 Legal Dashboard in Power BI — Track legal cases, costs, and performance with interactive Power BI visuals and dynamic filters.
📌 Arbitration and Mediation Dashboard in Power BI — Monitor dispute resolution cases, claim amounts, and settlement outcomes with advanced analytics.
📌 Law Firm Performance Dashboard in Excel — Same powerful law firm analytics built entirely in Excel with pivot tables and slicers.
📖 Click here to read the Detailed Blog Post
🎥 Visit our YouTube channel to learn step-by-step video tutorials
👉 YouTube.com/@NextGenTemplates
Watch the step-by-step video tutorial:
YouTube


Reviews
There are no reviews yet.