


The IT KPI Dashboard in Power BI is a powerful and interactive tool designed for IT managers, network administrators, and business analysts to monitor, track, and optimize IT operations. This customizable dashboard allows you to track key performance indicators (KPIs) such as system uptime, network performance, IT support tickets, and hardware/software health—all in one centralized location.
With real-time data integration and interactive visualizations, this Power BI dashboard provides insights into your IT infrastructure, helping you make informed decisions to enhance system performance, reduce downtime, and improve IT service delivery. The dashboard is designed to help businesses streamline their IT operations and ensure that IT resources are aligned with business goals.
Key Features of the IT KPI Dashboard in Power BI
🖥️ Comprehensive IT Performance Tracking
Monitor critical KPIs such as system uptime, network performance, IT service response times, and support ticket resolution. Track the health of your entire IT ecosystem and ensure smooth operations.
⚡ Real-Time IT Operations Monitoring
Stay updated on IT performance metrics in real time, with live data showing the status of your systems, networks, and IT resources. Quickly identify issues and take corrective actions before they impact business operations.
📈 Service & Support Metrics
Track IT service metrics such as response time, ticket resolution time, and customer satisfaction. Analyze trends in service delivery and optimize IT support functions to improve user experience.
📅 Customizable IT KPIs
Tailor the dashboard to track IT KPIs relevant to your business, whether it’s focusing on system uptime, security incidents, or hardware performance. Adapt the dashboard to your unique IT needs and goals.
🖥️ Interactive & User-Friendly Interface
The Power BI dashboard is designed to be intuitive and interactive, allowing for easy data entry, analysis, and reporting. Use features such as slicers and filters to drill down into data and make informed decisions.
Why You’ll Love the IT KPI Dashboard in Power BI

✅ Track Key IT Metrics in One Place
Monitor vital IT KPIs such as system uptime, IT service performance, ticket resolution, and network health—all in one dashboard. Get a complete view of your IT infrastructure and operations.
✅ Optimize IT Operations & Service Delivery
Identify bottlenecks, performance issues, and service gaps to optimize IT processes. Improve network efficiency, reduce downtime, and enhance the performance of your IT support team.
✅ Enhance IT Service Management
Analyze IT service metrics to identify areas of improvement in ticket resolution times, service response times, and overall customer satisfaction. Improve the quality of IT support and user experience.
✅ Data-Driven Decision Making
Leverage insights from real-time data to make strategic decisions regarding IT resources, network upgrades, and system improvements, ensuring your IT infrastructure supports business objectives.
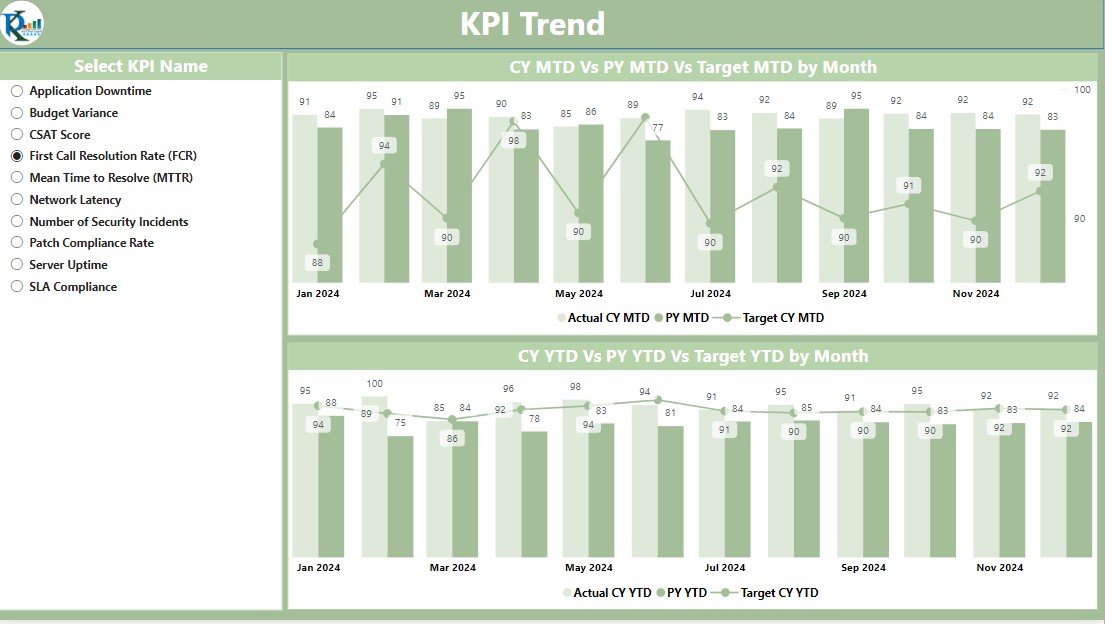
✅ Visualize IT Performance Trends
Use Power BI’s interactive charts and graphs to visualize trends in system performance, ticket resolution, and service metrics. Gain insights into long-term patterns and operational efficiency.
What’s Inside the IT KPI Dashboard in Power BI?
- IT System Performance Tracking: Monitor key performance metrics such as system uptime, network health, and hardware/software performance.
- Support & Service Metrics: Track ticket resolution, service response times, and customer satisfaction with IT services.
- Real-Time Monitoring: Monitor IT operations in real-time and compare actual performance against targets.
- Customizable KPIs: Adjust the dashboard to track IT metrics specific to your business needs.
- Interactive Reporting: Drill down into data using slicers, filters, and visual charts for deeper insights.
How to Use the IT KPI Dashboard in Power BI
1️⃣ Download the Template: Access your IT KPI Dashboard in Power BI instantly.
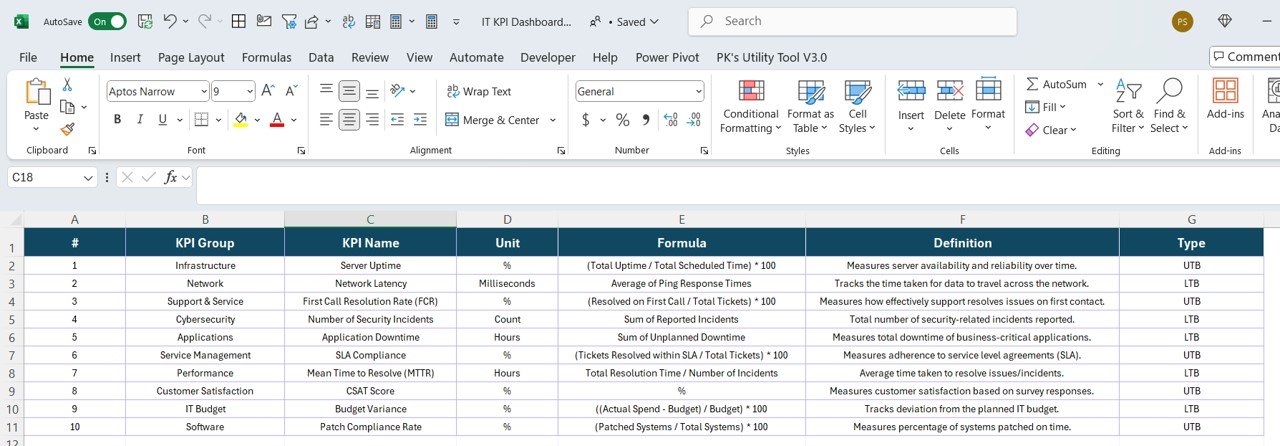
2️⃣ Enter IT Data: Input data such as system performance, service tickets, network status, and hardware health.
3️⃣ Monitor KPIs: Track real-time IT performance and compare actual data against targets.
4️⃣ Analyze & Optimize: Use insights from the dashboard to optimize IT operations, improve service delivery, and reduce downtime.
Who Can Benefit from the IT KPI Dashboard in Power BI?
🔹 IT Managers & Network Administrators
🔹 IT Service & Support Teams
🔹 Business Analysts & Data Analysts
🔹 CTOs & IT Directors
🔹 Organizations Looking to Optimize IT Operations
🔹 Any Business Needing Comprehensive IT Insights
Track, analyze, and optimize your IT operations with the IT KPI Dashboard in Power BI. Stay on top of system performance, service metrics, and network health to ensure that your IT infrastructure runs smoothly and supports business objectives.
Click here to read the Detailed blog post
Visit our YouTube channel to learn step-by-step video tutorials
Youtube.com/@PKAnExcelExpert


Reviews
There are no reviews yet.