Managing IT infrastructure without clear visibility often results in unexpected downtime, operational inefficiencies, and increased business risk. The IT Infrastructure KPI Scorecard in Excel is a ready-to-use, professional performance tracking solution designed to give IT teams instant clarity, control, and actionable insights — all inside Microsoft Excel.
This Excel-based KPI scorecard helps you monitor critical IT infrastructure metrics such as server uptime, network availability, incident resolution time, compliance levels, and system performance trends from a single, centralized file. Instead of juggling multiple reports, emails, or tools, you can now track everything in one structured and visual scorecard 📊.
Designed for simplicity and power, this template enables IT teams to move from reactive firefighting to proactive performance management — without expensive software or complex implementations.
✅ Key Features of IT Infrastructure KPI Scorecard in Excel
-
📌 Centralized KPI Monitoring – Track all IT infrastructure KPIs in one structured Excel workbook
-
🎯 Actual vs Target Comparison – Instantly identify gaps using clear performance indicators
-
📈 MTD & YTD Performance Tracking – Monitor short-term and long-term trends effortlessly
-
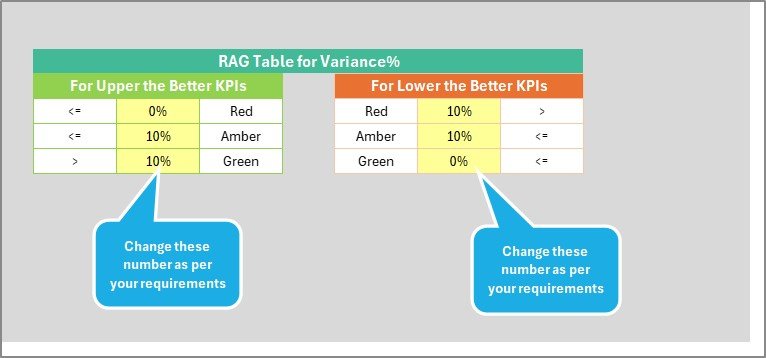
🎨 Visual Performance Indicators – Color-coded status highlights critical issues instantly
-
🔄 Dynamic KPI Selection – Analyze individual KPIs using dropdown-driven analysis
-
🧮 Built-in KPI Definitions – Ensure consistency with standardized formulas and explanations
-
🖥️ Excel-Based & Cost-Effective – No additional tools, licenses, or technical setup required
📦 What’s Inside the IT Infrastructure KPI Scorecard in Excel
This ready-to-use Excel template includes four professionally designed worksheets, each serving a specific analytical purpose:
-
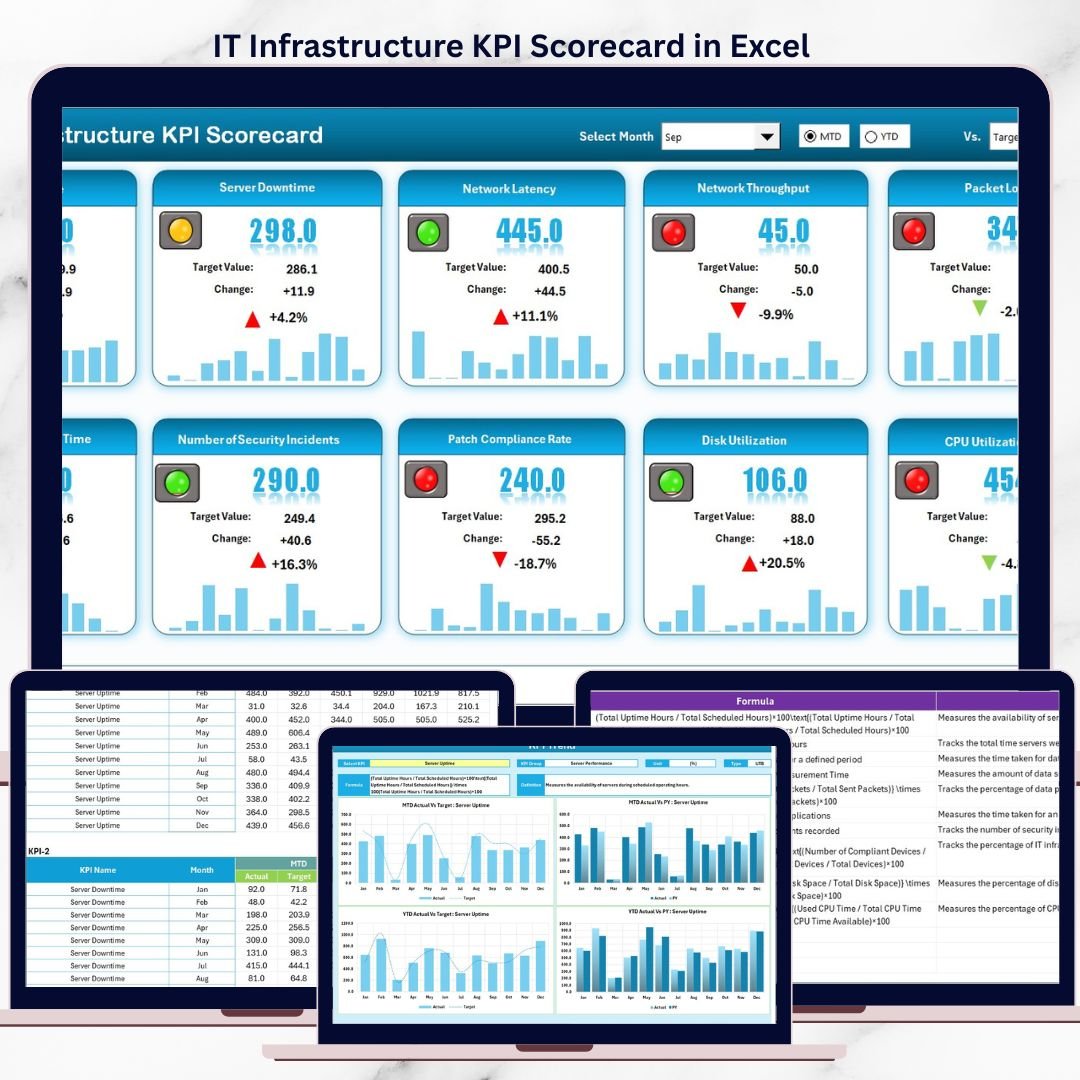
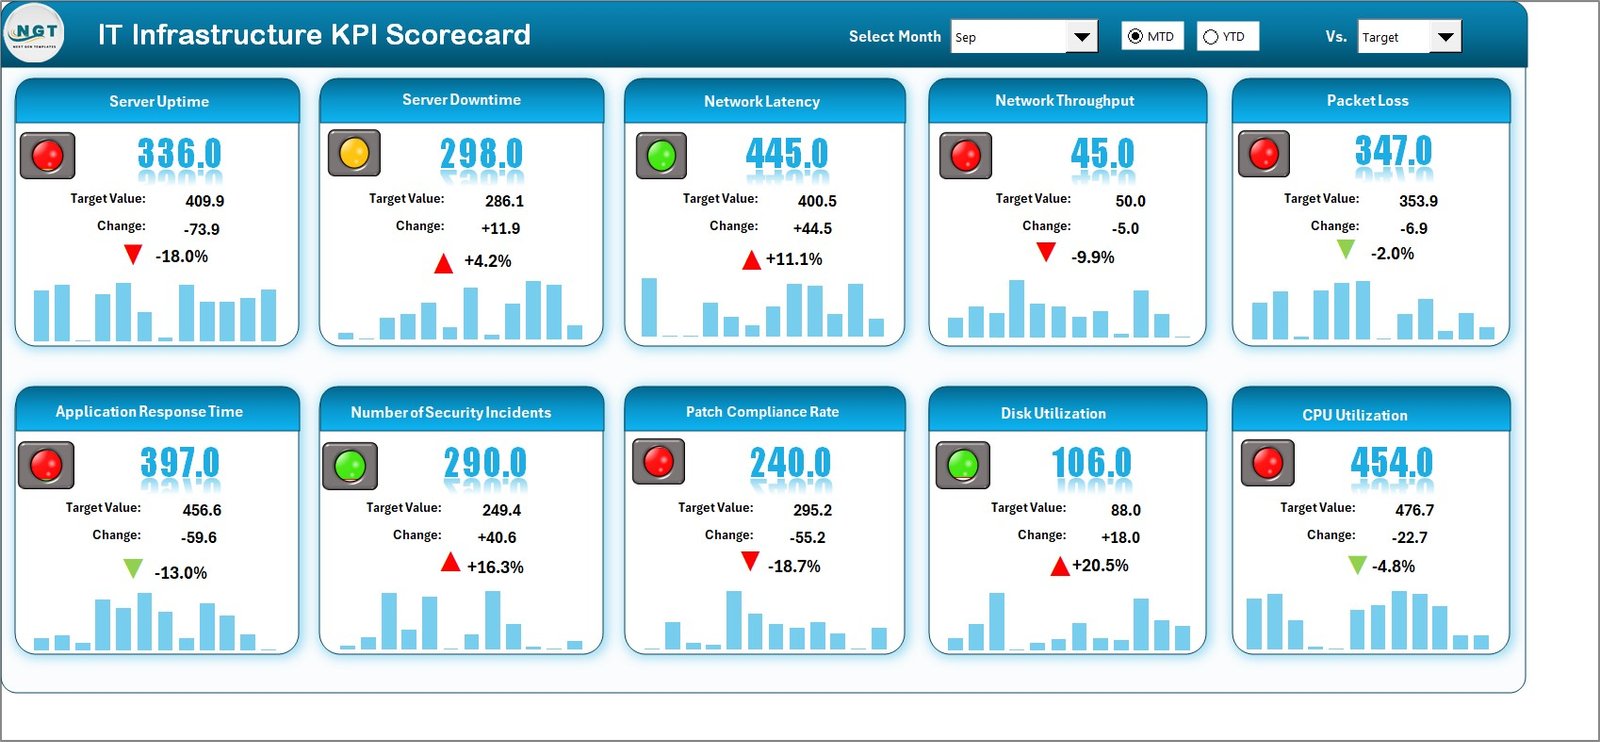
🧭 Scorecard Sheet
Provides an executive-level overview with KPI group, unit, type, MTD, YTD, actuals, targets, and performance status. -
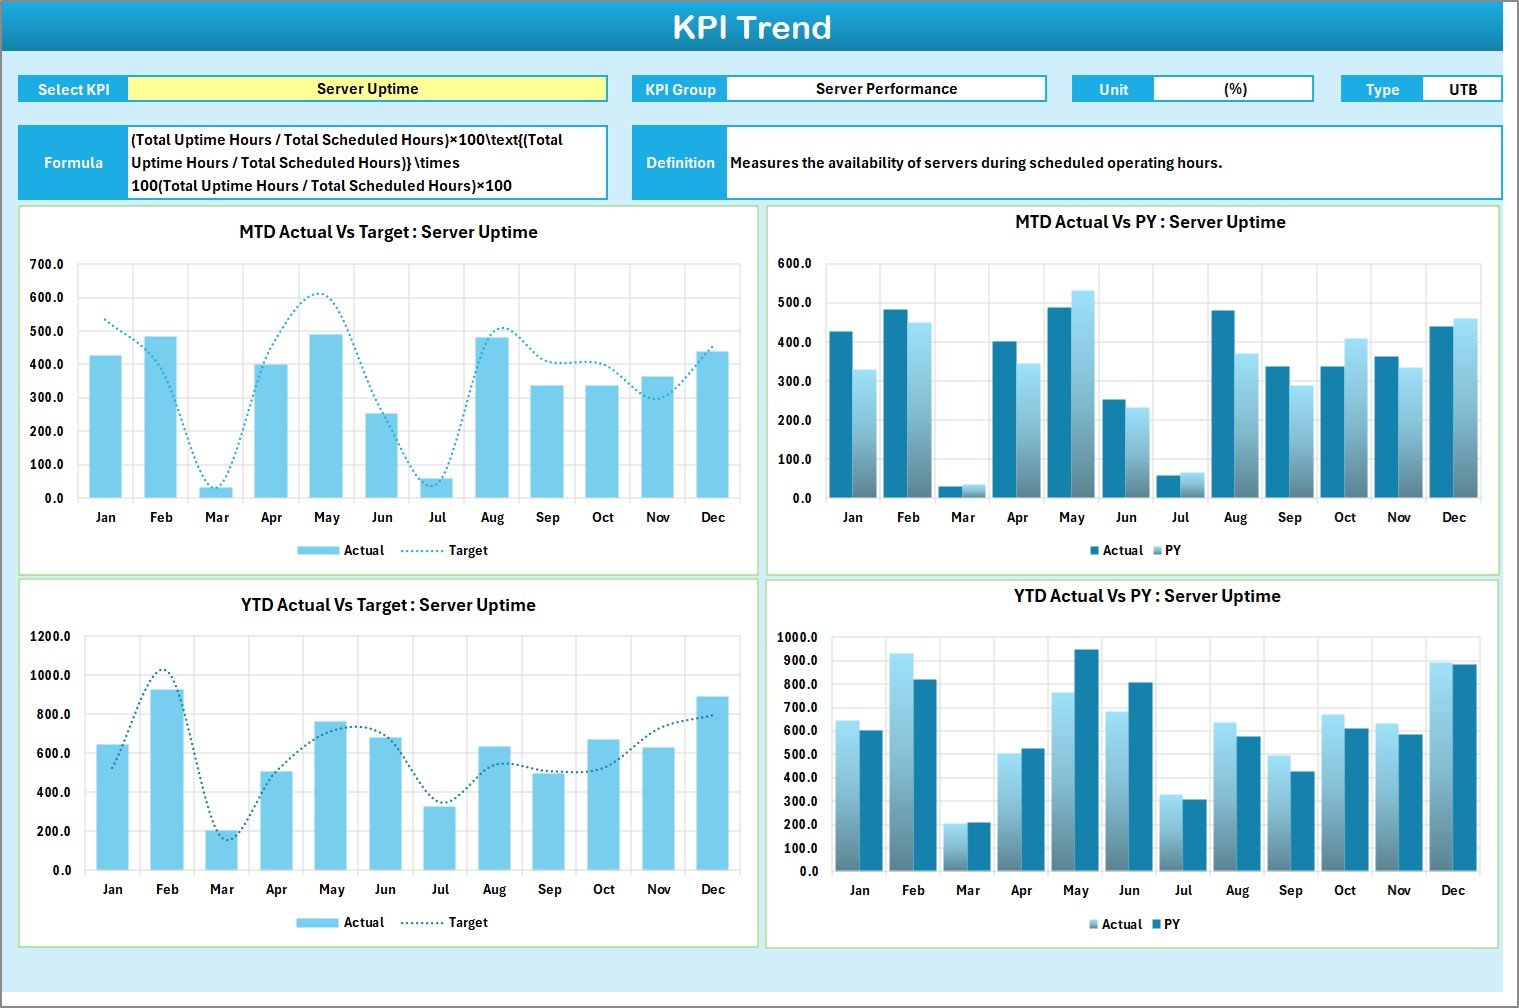
📊 KPI Trend Sheet
Enables deep-dive analysis with dynamic KPI selection, trend charts for Actual, Target, and Previous Year values. -
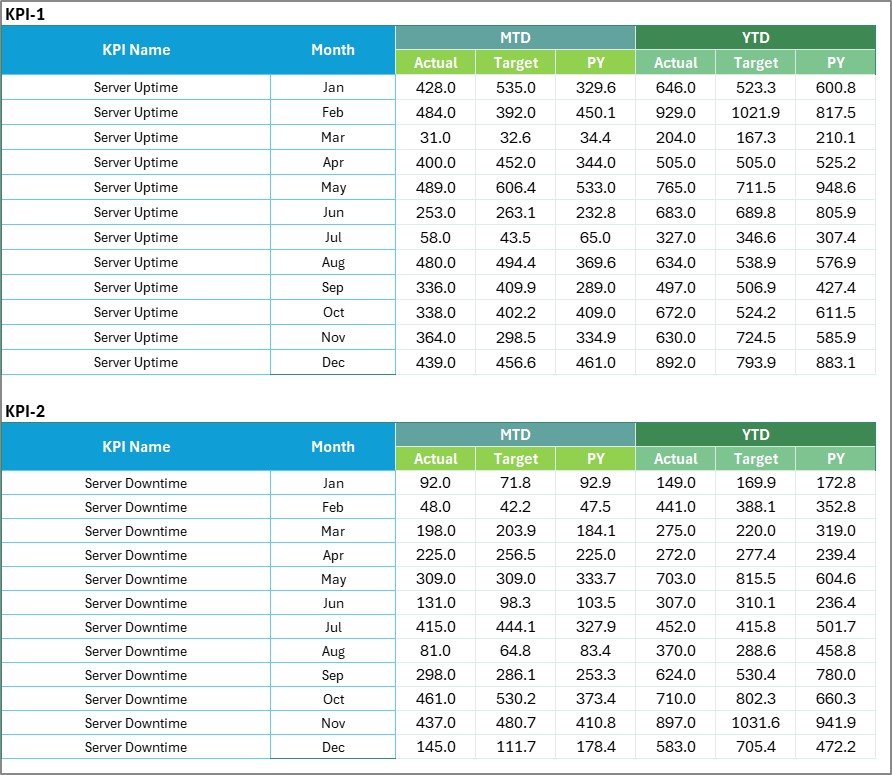
📝 Input Data Sheet
A structured data entry area where teams input KPI values, targets, and supporting metrics. -
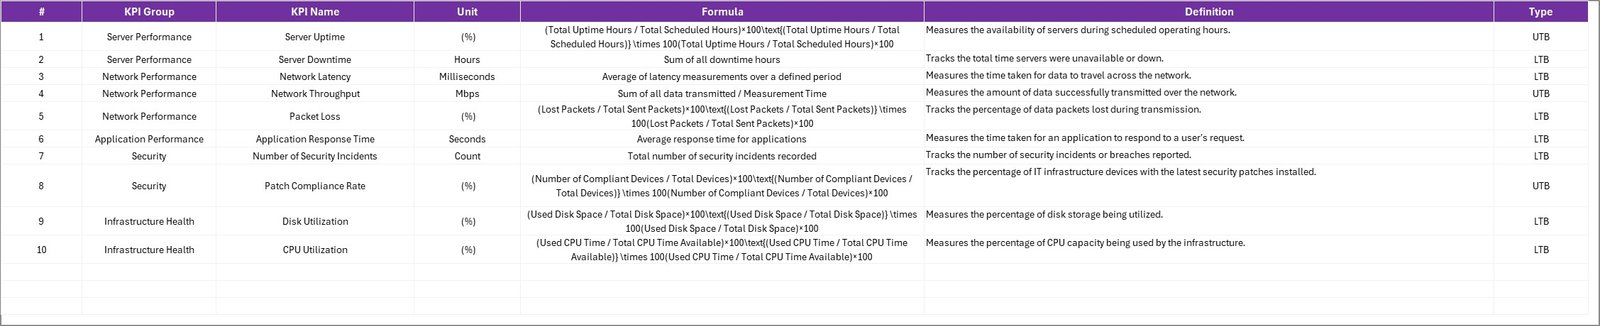
📘 KPI Definition Sheet
Documents KPI name, group, unit, formula, and definition to maintain governance and clarity.
Together, these sheets ensure accuracy, transparency, and professional reporting.
🛠️ How to Use the IT Infrastructure KPI Scorecard in Excel
Using the scorecard is simple and intuitive:
1️⃣ Define your IT infrastructure KPIs and targets
2️⃣ Enter actual performance data in the Input Data Sheet
3️⃣ Review Actual vs Target performance on the Scorecard
4️⃣ Analyze KPI behavior using MTD & YTD trend charts
5️⃣ Identify risks, gaps, and improvement areas proactively
No advanced Excel skills are required — basic Excel knowledge is enough to get started.
👥 Who Can Benefit from This IT Infrastructure KPI Scorecard?
This Excel KPI Scorecard is ideal for:
-
🧑💼 IT Managers & Infrastructure Leads
-
🖥️ System & Network Administrators
-
🔧 IT Operations & NOC Teams
-
📋 IT Service Management (ITSM) Teams
-
🧠 CIOs & IT Leadership
Whether you manage a small IT environment or a complex enterprise infrastructure, this scorecard adapts easily to your needs.
📖 Click here to read the Detailed blog post
🎥 Visit our YouTube channel to learn step-by-step video tutorials
👉 Youtube.com/@PKAnExcelExpert


Reviews
There are no reviews yet.