Running intercity bus operations is no longer just about moving passengers from one city to another. Intercity Bus Services Dashboard in Power BI Today, operators must carefully balance fuel costs, toll expenses, route profitability, booking channels, cancellations, and customer satisfaction—all while staying competitive in a margin-driven market. Unfortunately, when data sits in disconnected spreadsheets or manual reports, decisions become slow, reactive, and costly.
Intercity Bus Services Dashboard in Power BI That is exactly where the Intercity Bus Services Dashboard in Power BI becomes a powerful and practical solution.
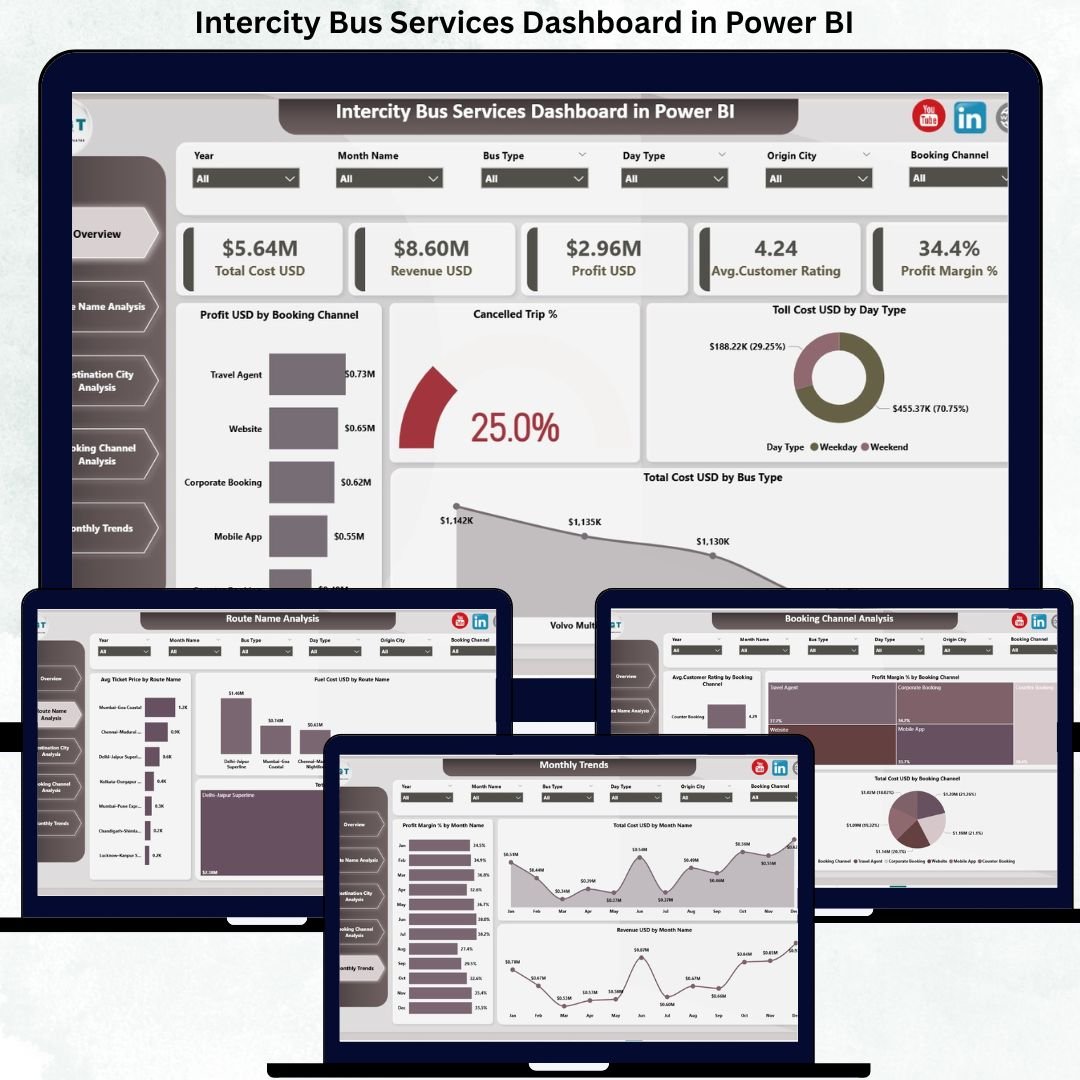
This professionally designed Power BI dashboard transforms complex operational and financial data into clear, interactive, and actionable insights. Instead of guessing which routes, cities, or booking channels drive profits, you gain real-time visibility into performance, costs, and customer experience—all in one centralized dashboard.
🚀 Key Features of Intercity Bus Services Dashboard in Power BI
📊 Interactive Power BI Visuals – Replace static reports with dynamic, drillable insights
🎯 KPI Cards for Instant Health Check – Monitor cost, revenue, profit, ratings, and margin
🗺️ Route-Wise Performance Analysis – Identify high-cost and high-profit routes quickly
🏙️ City-Wise Profitability Insights – Track revenue, profit, and cancellations by destination
💳 Booking Channel Analysis – Optimize channel mix based on cost, margin, and ratings
❌ Cancellation & Customer Rating Tracking – Improve service reliability and satisfaction
📈 Monthly Trend Analysis – Detect seasonal patterns and cost fluctuations
🎛️ Dynamic Slicers – Filter insights by route, city, channel, or month instantly
📦 What’s Inside the Intercity Bus Services Dashboard
This Power BI product includes five well-structured analytical pages; each focused on a critical aspect of intercity bus operations.
🔹 Overview Page
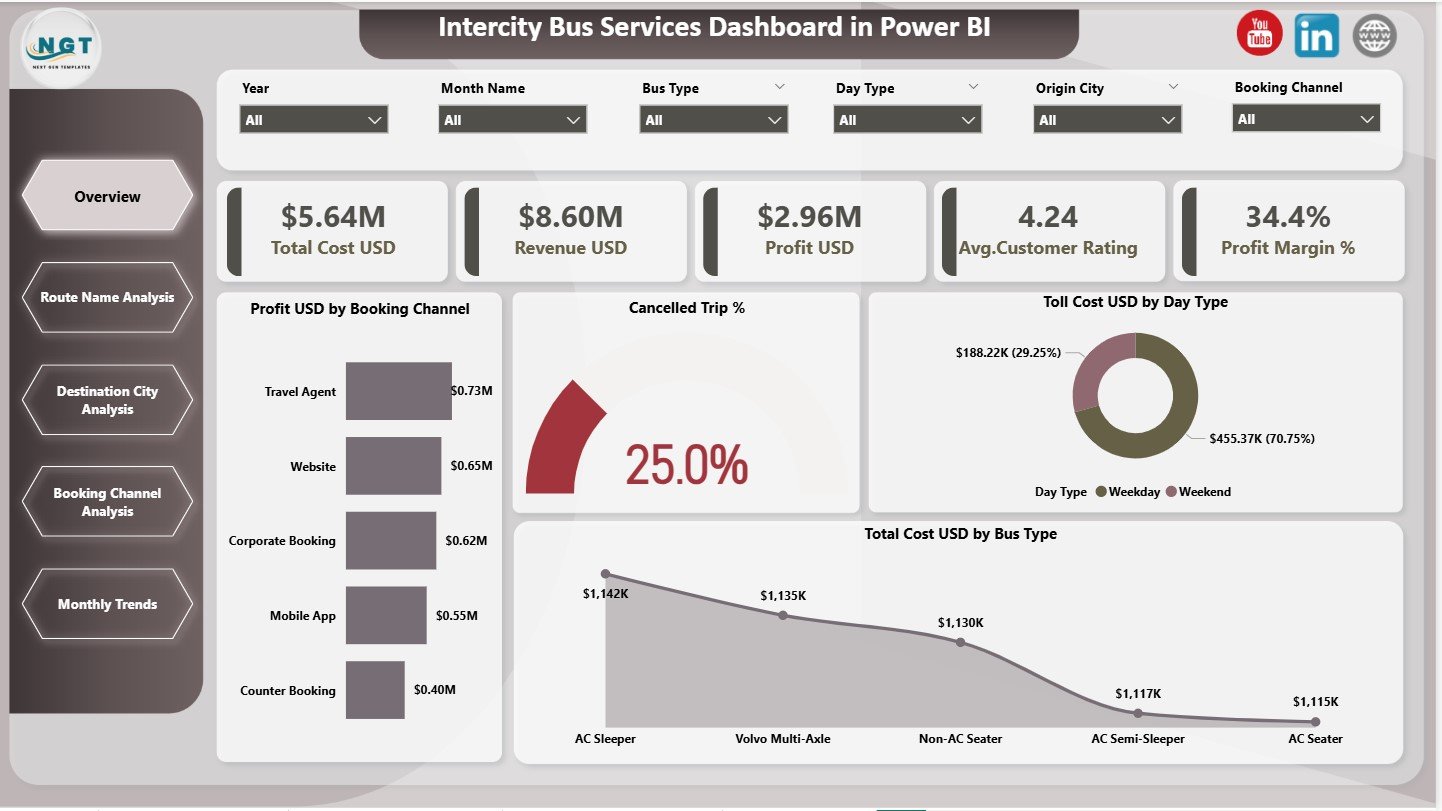
The main performance snapshot displaying:
-
Total Cost (USD)
-
Revenue (USD)
-
Profit (USD)
-
Average Customer Rating
-
Profit Margin (%)
It also includes charts for profit by booking channel, cancellation percentage, toll cost by day type, and total cost by bus type.
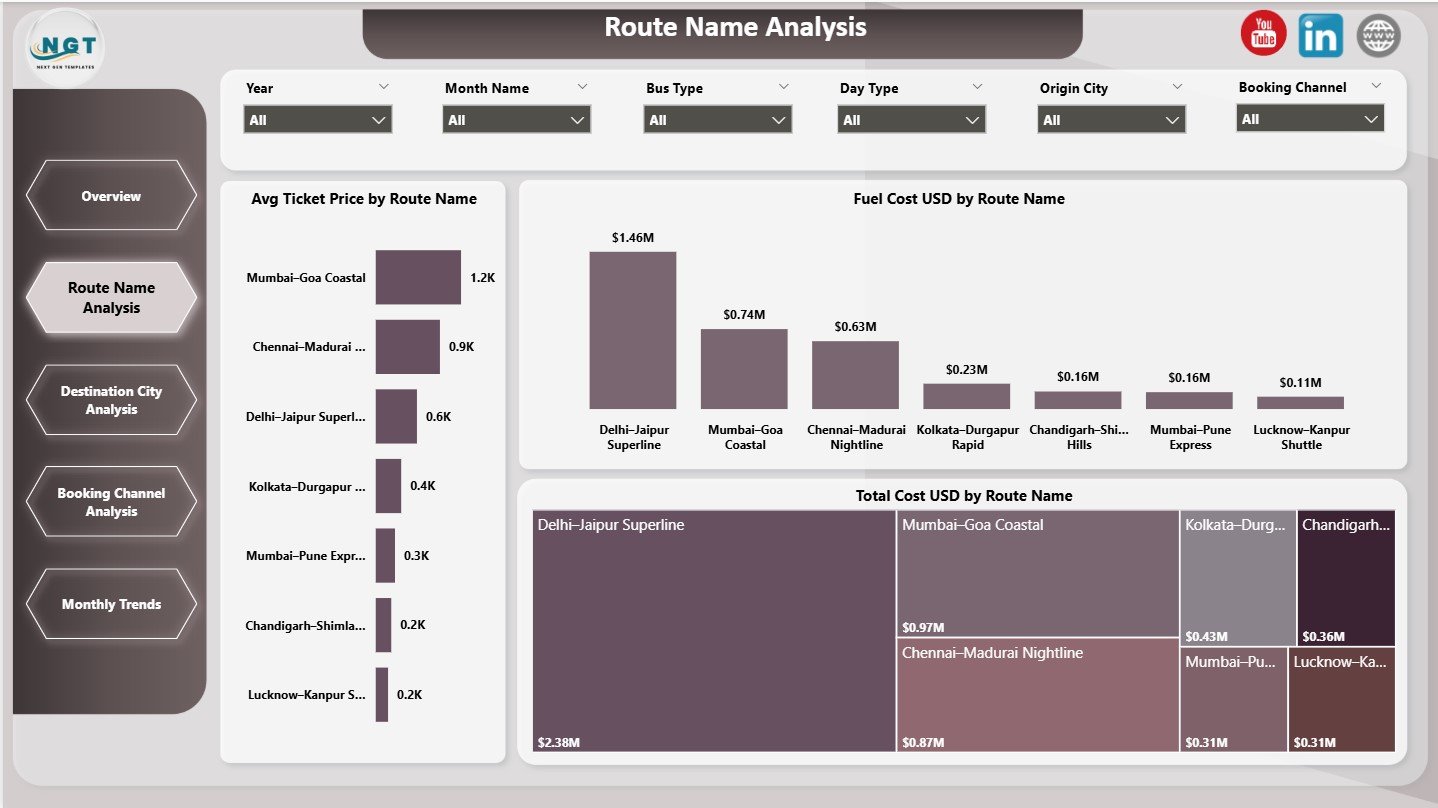
🔹 Route Name Analysis Page
Focuses on route-level performance with charts such as:
-
Average Ticket Price by Route
-
Fuel Cost by Route
-
Total Cost by Route
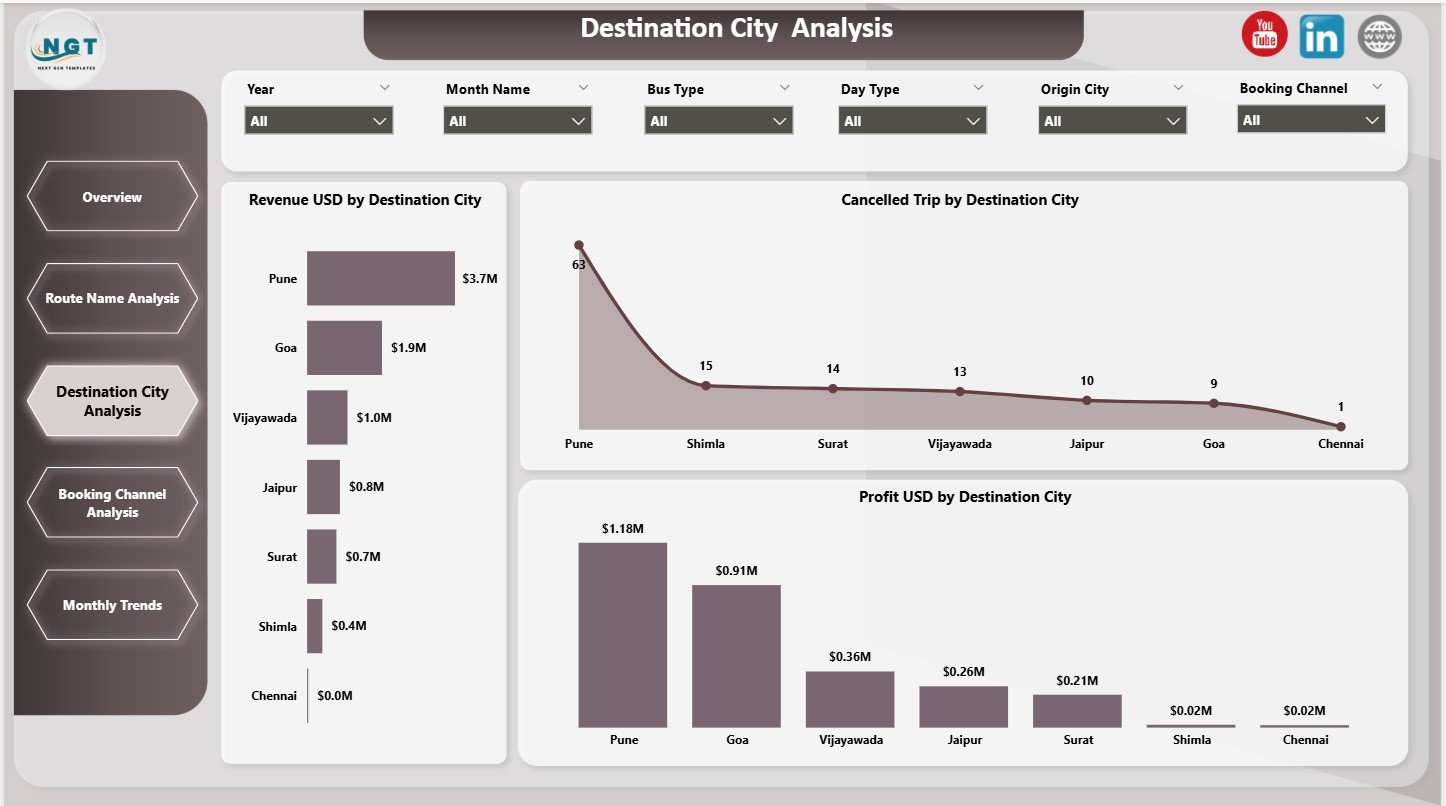
🔹 Destination City Analysis Page
Highlights city-wise performance using:
-
Revenue by Destination City
-
Cancelled Trips by Destination City
-
Profit by Destination City
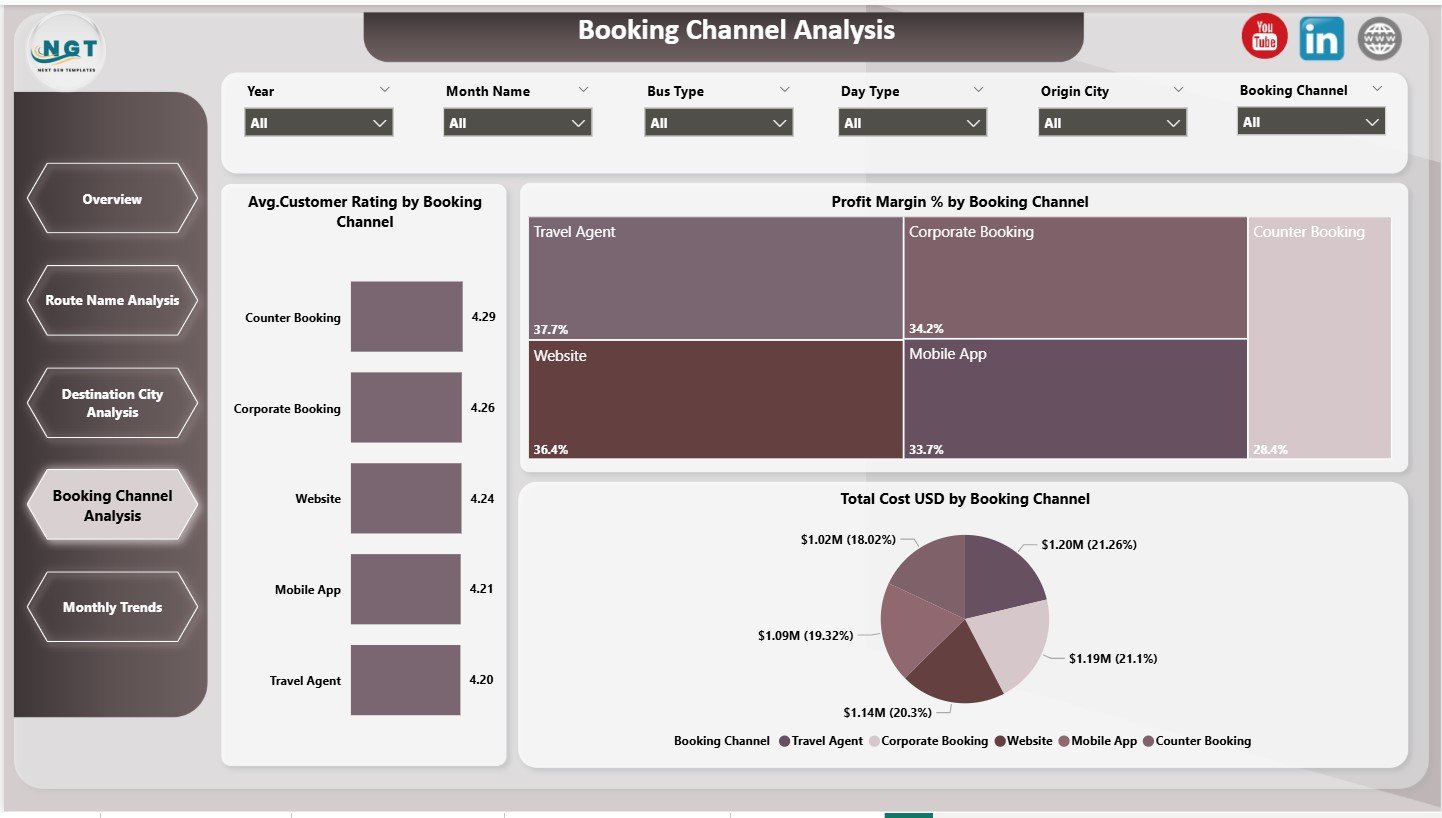
🔹 Booking Channel Analysis Page
Evaluates performance across booking platforms using:
-
Average Customer Rating by Channel
-
Profit Margin (%) by Channel
-
Total Cost by Channel
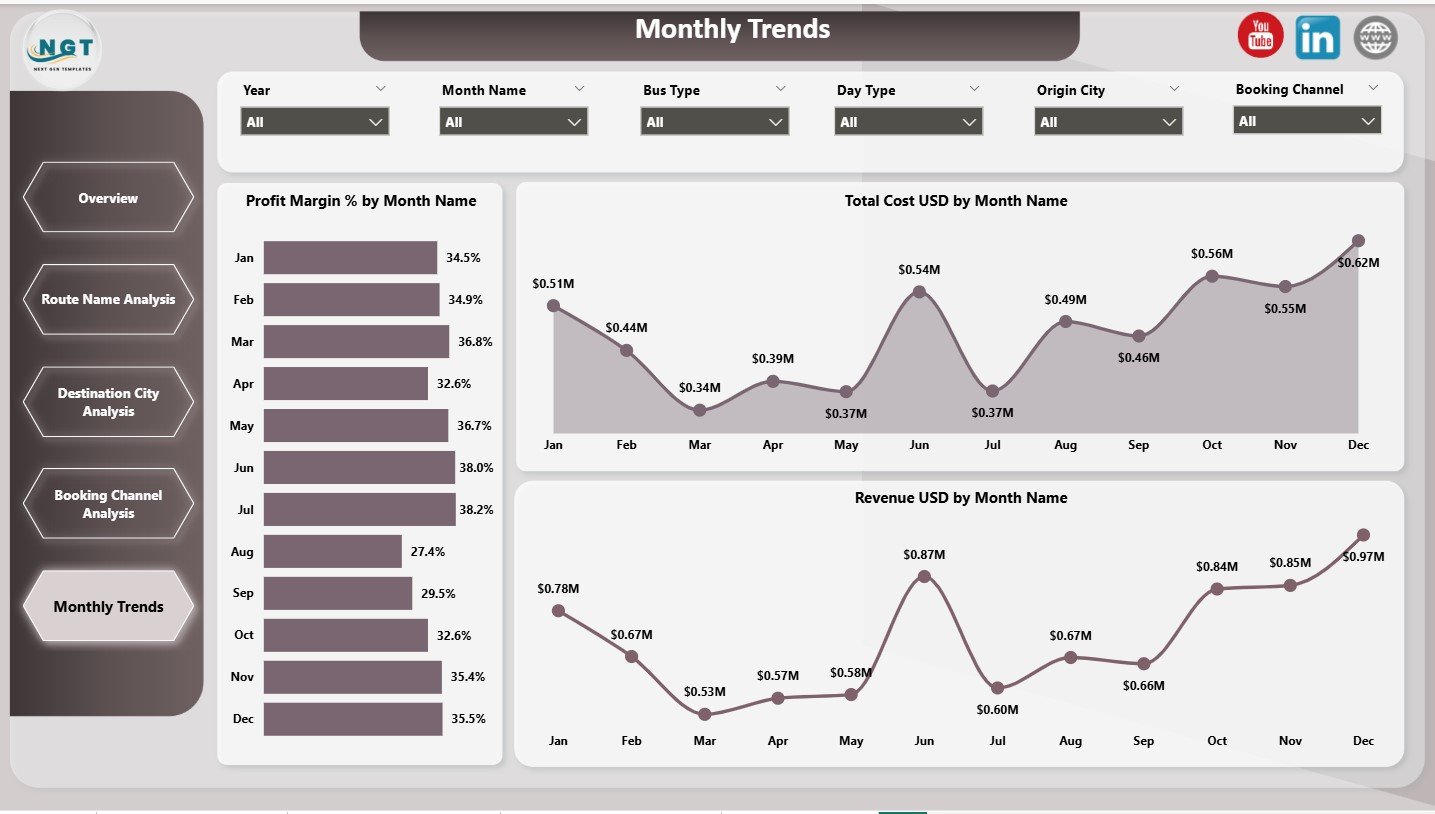
🔹 Monthly Trends Page
Supports planning and forecasting with:
-
Revenue by Month
-
Total Cost by Month
-
Profit Margin (%) by Month
Together, these pages deliver complete operational and financial clarity.
🛠️ How to Use the Intercity Bus Services Dashboard
Using this dashboard is simple and business friendly.
1️⃣ Load your operational and financial data into the data source
2️⃣ Refresh the Power BI dashboard
3️⃣ Use slicers to filter by route, city, booking channel, or month
4️⃣ Analyze KPIs, charts, and trends instantly
5️⃣ Use insights to optimize routes, pricing, and channel strategy
Because everything runs inside Power BI, insights remain fast, interactive, and scalable.
👥 Who Can Benefit from This Intercity Bus Services Dashboard?
This dashboard is ideal for:
🚌 Intercity Bus Operators
📊 Operations & MIS Teams
💼 Transport & Mobility Managers
📈 Strategy and Planning Teams
🧾 Finance & Cost Control Teams
🌍 Large and Multi-City Bus Networks
If you want better margins, stronger cost control, and happier customers, this dashboard is built for you.
🔎 Click here to read the Detailed blog post
👉 Visit our YouTube channel to learn step-by-step video tutorials


Reviews
There are no reviews yet.