Intellectual Property (IP) KPI Dashboard has evolved from a legal formality into a strategic business asset. Today, organizations must track patents, trademarks, copyrights, filings, approvals, renewals, costs, timelines, and compliance with the same rigor as financial or operational KPIs. However, when IP data stays scattered across Excel files, emails, and static reports, visibility drops and decision-making slows.
That is exactly where the Intellectual Property (IP) KPI Dashboard in Power BI becomes a powerful and modern solution 📊⚖️🚀.
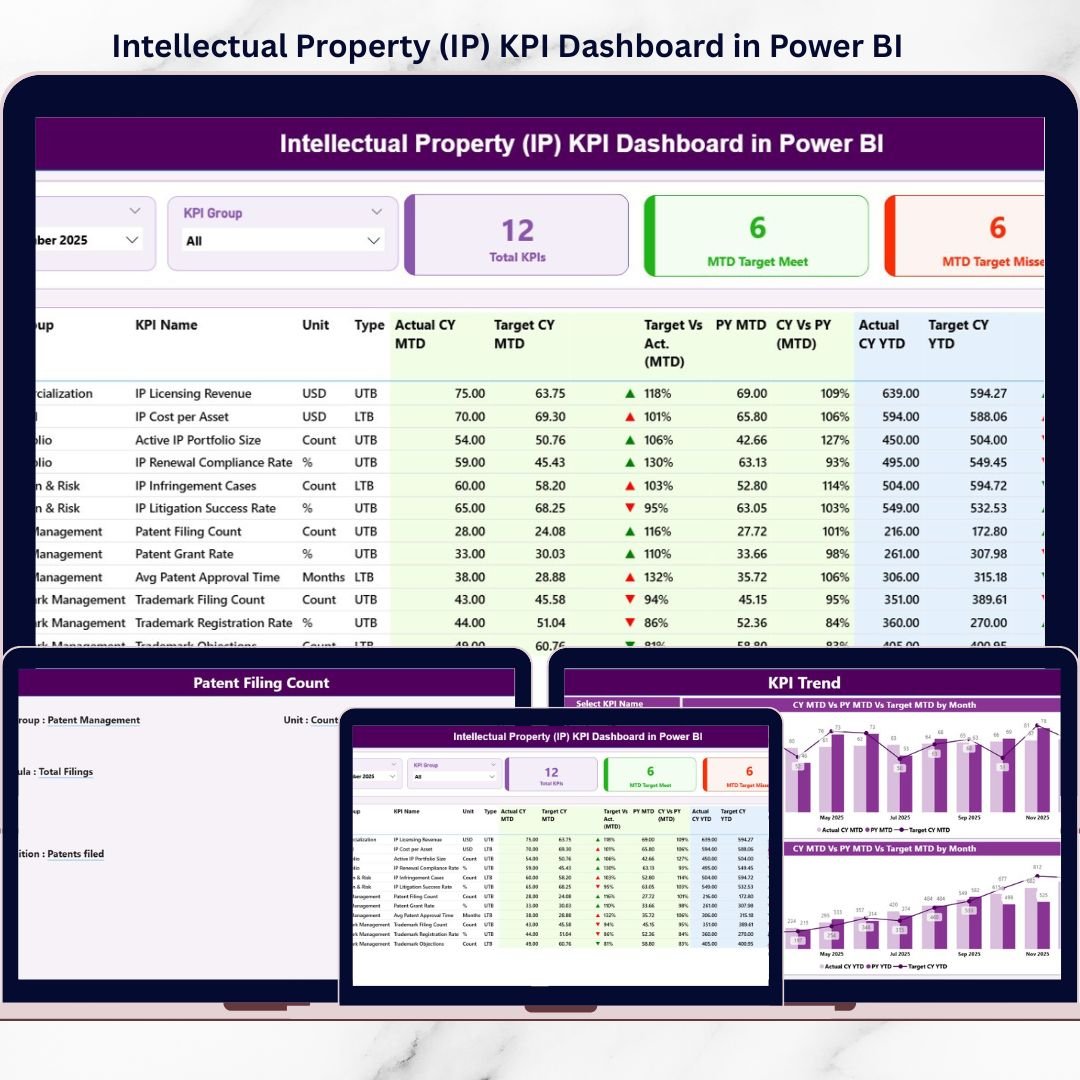
This ready-to-use Power BI dashboard is designed to help organizations measure, monitor, and manage IP performance in a structured and visual way. Instead of manually preparing reports, teams get real-time insights into Month-to-Date (MTD), Year-to-Date (YTD), Target vs Actual, and Previous Year performance—all in one interactive dashboard.
Because this dashboard uses Excel as a data source and Power BI for visualization, it combines simplicity with advanced analytics. As a result, legal teams, IP managers, R&D leaders, and executives gain clarity, control, and confidence in IP decision-making.
## Key Features of Intellectual Property (IP) KPI Dashboard in Power BI 🚀
This dashboard is purpose-built for IP performance tracking and governance.
📌 Centralized IP KPI Monitoring
Track all intellectual property KPIs in one interactive Power BI dashboard.
📊 MTD & YTD Performance Analysis
Monitor short-term and long-term IP performance effortlessly.
🎯 Target vs Actual Comparison
Instantly identify KPIs that meet or miss targets using visual indicators.
📅 Previous Year Benchmarking
Compare current performance with last year to measure progress clearly.
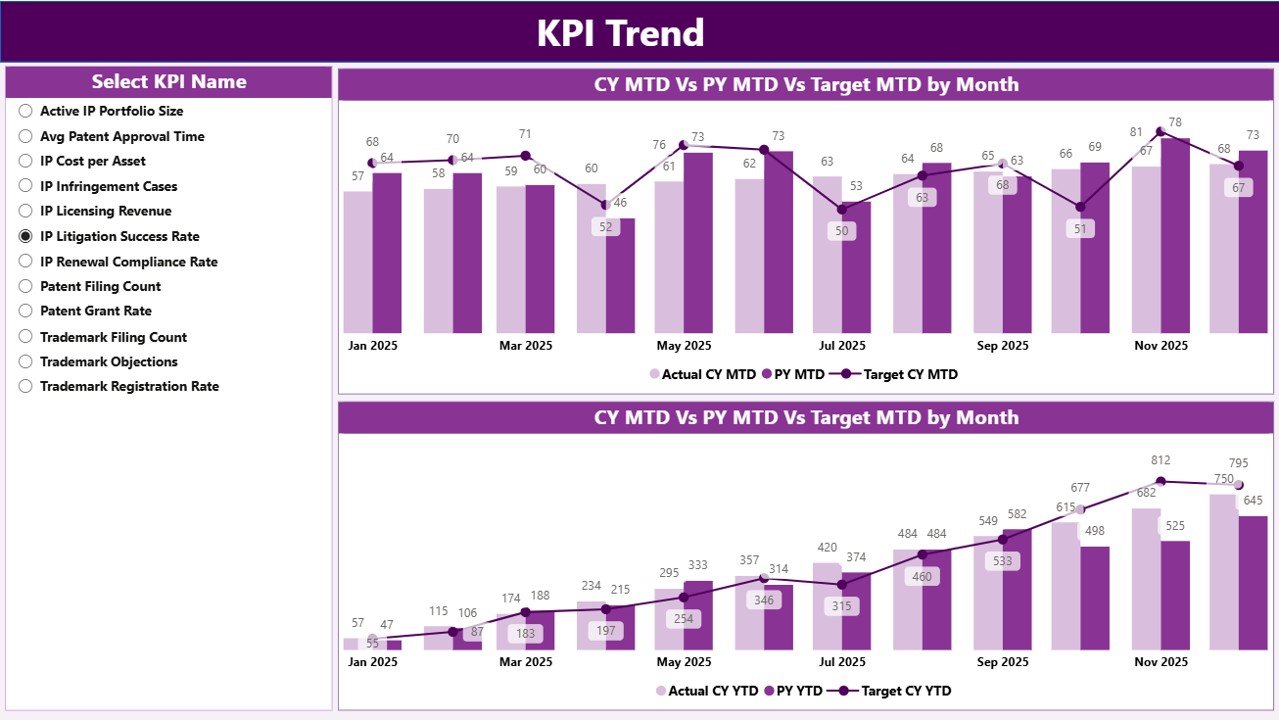
📈 KPI Trend Analysis
Analyze MTD and YTD trends using interactive combo charts.
🔺 LTB & UTB KPI Logic
Supports both Lower the Better and Upper the Better KPIs accurately.
🎛️ Interactive Slicers
Filter KPIs by Month and KPI Group for focused analysis.
⚡ Excel + Power BI Architecture
Easy Excel data entry with powerful Power BI analytics.
## What’s Inside the Intellectual Property (IP) KPI Dashboard in Power BI 📂
This dashboard includes three professionally designed Power BI pages, supported by structured Excel input sheets.
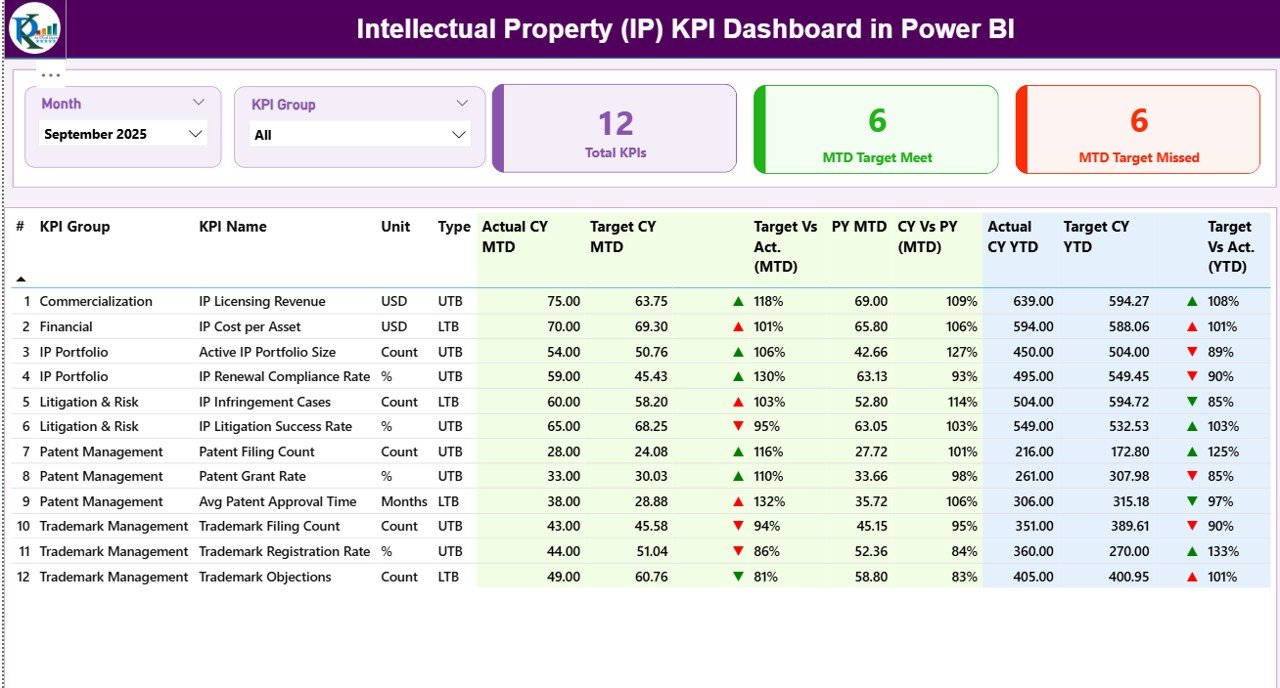
🟦 Summary Page
Acts as the command center of the dashboard. It includes:
-
Month and KPI Group slicers
-
KPI cards for Total KPIs, MTD Target Met, and MTD Target Missed
-
A detailed KPI table showing MTD, YTD, Target vs Actual, and Previous Year comparisons with arrows and colors
🟦 KPI Trend Page
Focuses on deep KPI analysis using:
-
MTD trend combo chart
-
YTD trend combo chart
-
KPI Name slicer to analyze one KPI at a time
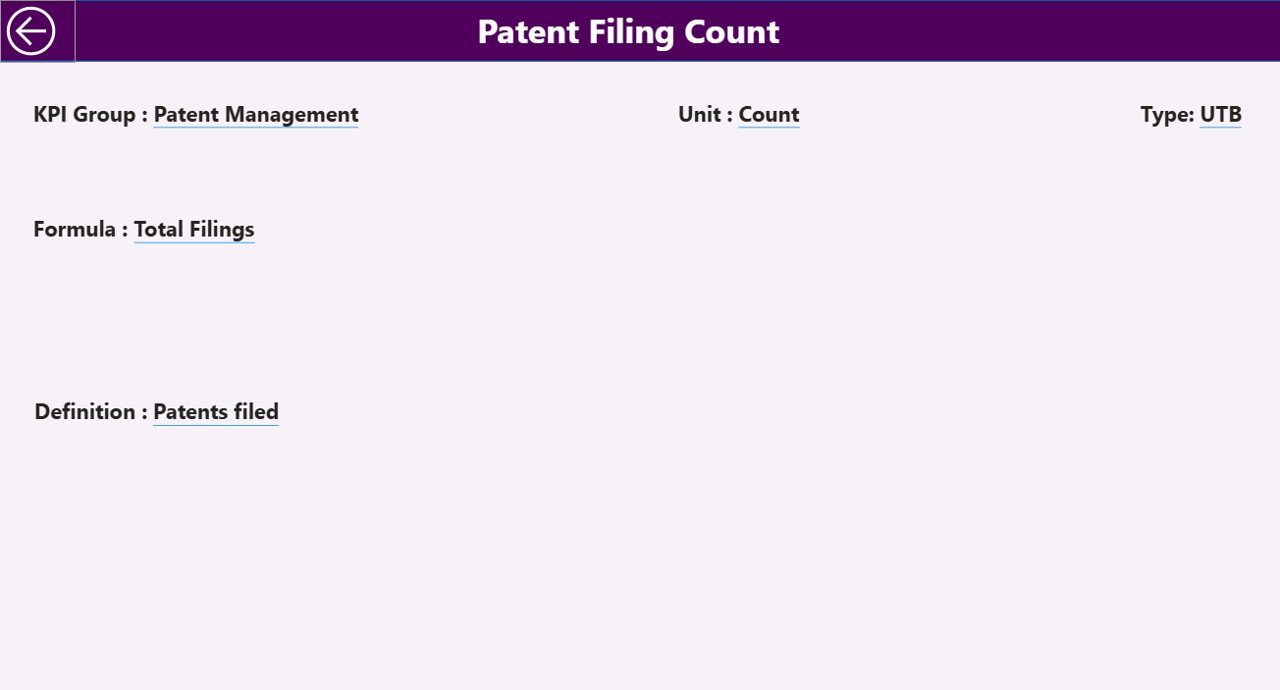
🟦 KPI Definition Page
A drill-through reference page that displays:
-
KPI Formula
-
KPI Definition
-
Measurement logic
This page ensures complete clarity and governance.
## How to Use the Intellectual Property (IP) KPI Dashboard in Power BI 🧩
Using this dashboard is simple and efficient:
1️⃣ Enter actual KPI values in the Excel Input_Actual sheet
2️⃣ Enter target KPI values in the Input_Target sheet
3️⃣ Maintain KPI definitions in the KPI Definition sheet
4️⃣ Refresh the Power BI report
5️⃣ Select Month and KPI Group using slicers
6️⃣ Instantly review performance, trends, and gaps
Power BI automatically handles calculations, visuals, and comparisons—so teams focus on insights, not reporting.
## Who Can Benefit from This Intellectual Property (IP) KPI Dashboard 👥
This dashboard is ideal for:
✔️ Intellectual Property Teams
✔️ Legal & Compliance Departments
✔️ R&D and Innovation Teams
✔️ Patent & Trademark Offices
✔️ Corporate Legal Functions
✔️ IP Managers & General Counsels
✔️ Senior Leadership & Strategy Teams
Both technical and non-technical users can use it confidently.
### Click here to read the Detailed blog post
Visit our YouTube channel to learn step-by-step video tutorials
👉 https://youtube.com/@PKAnExcelExpert


Reviews
There are no reviews yet.