Insurance companies manage thousands of claims every month—each containing customer details, policy information, documents, brokers, payout amounts, and region-wise activity. One small delay or incorrect value can create chaos, slow down settlement, and reduce customer satisfaction. That’s why modern insurance companies now depend on Power BI dashboards to get instant visibility and make fast, data-driven decisions.
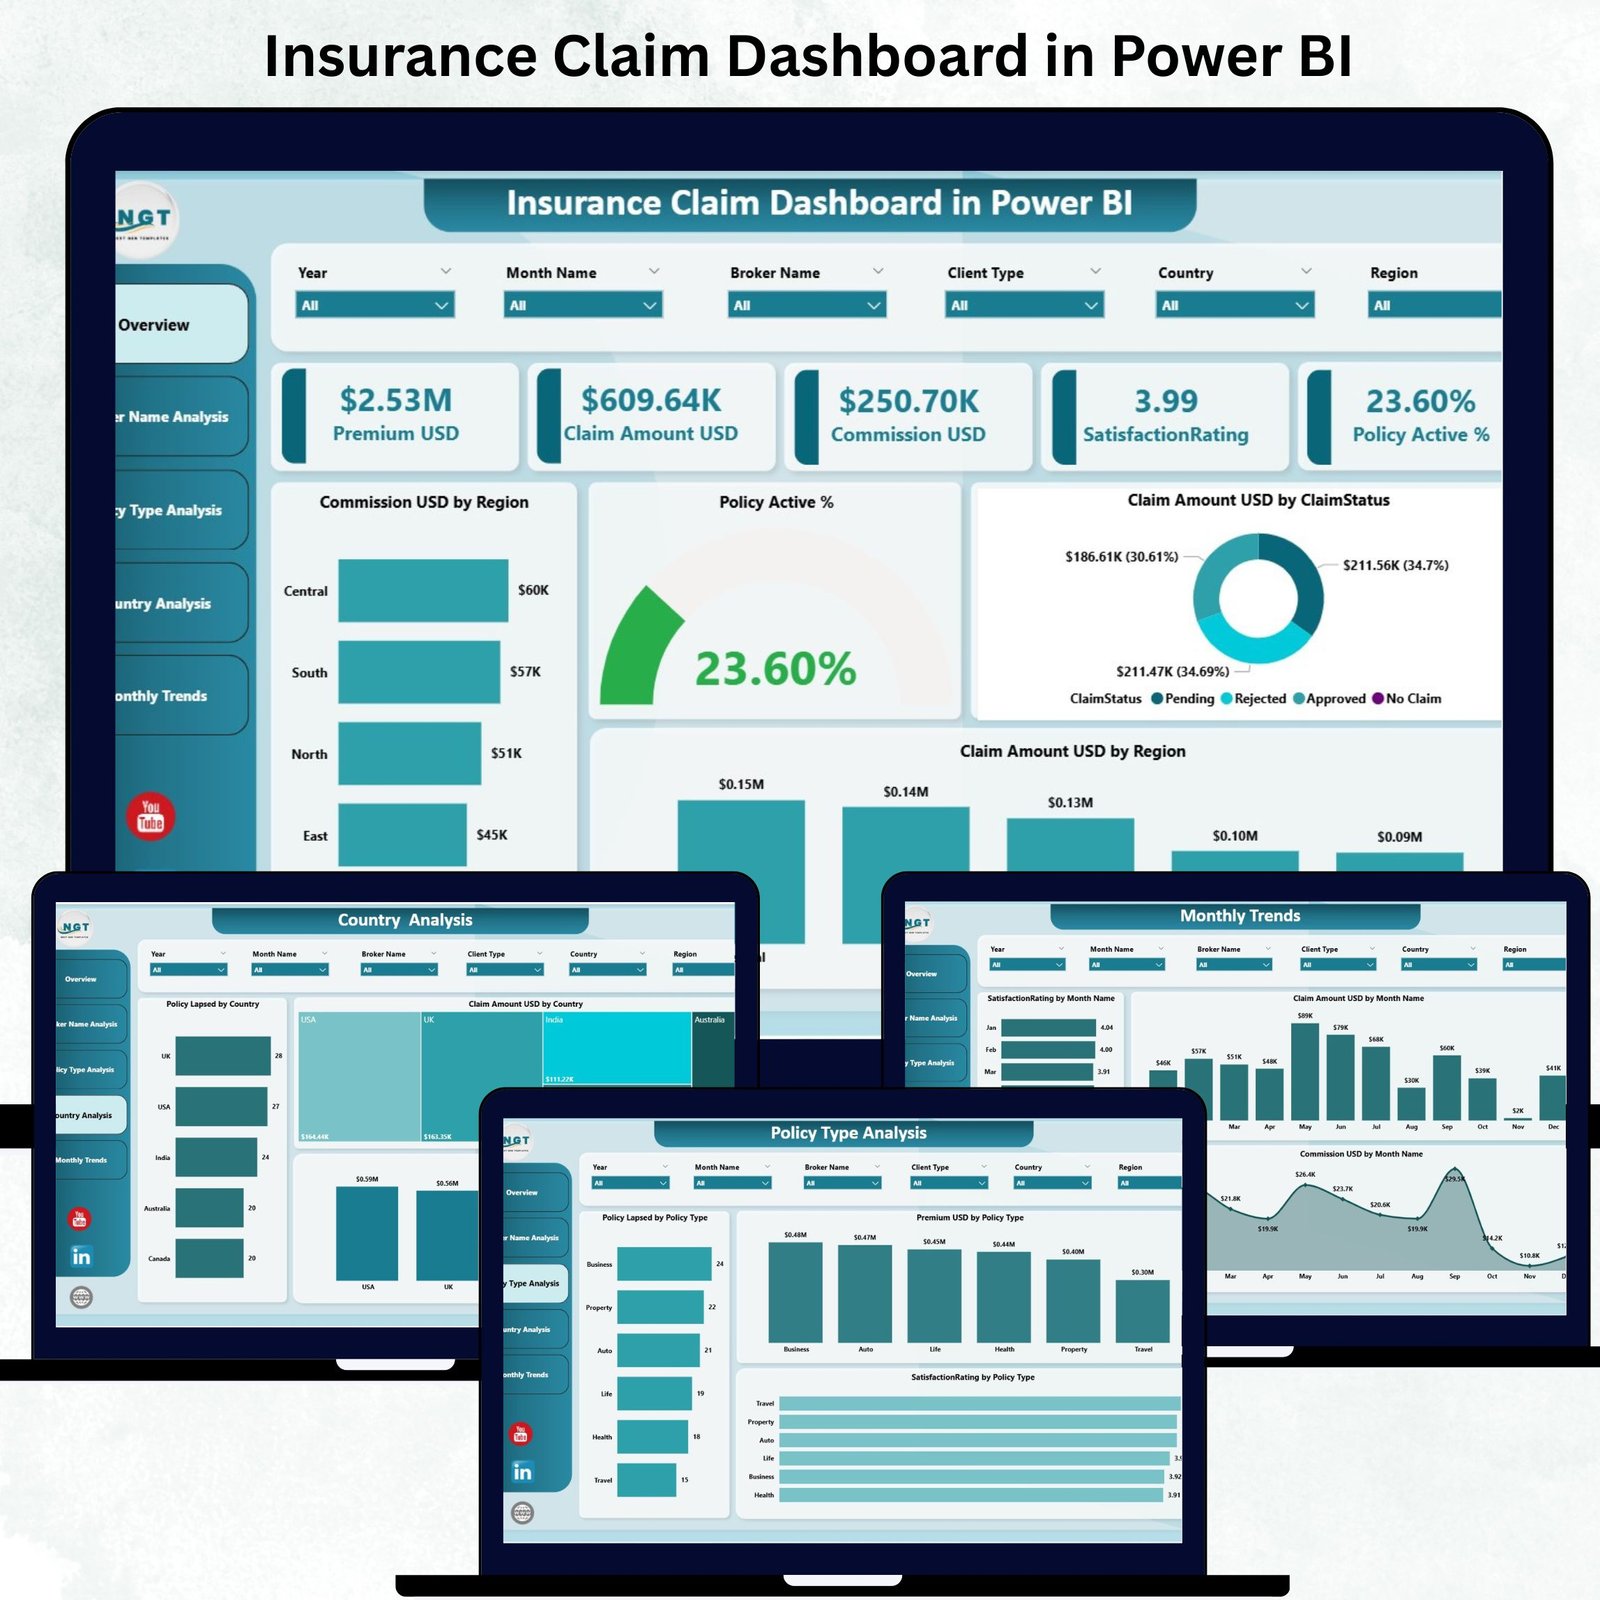
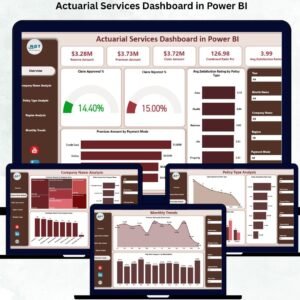
The Insurance Claim Dashboard in Power BI gives a complete 360° view of all insurance claim activities. It brings together claim amounts, policy lapses, commissions, premiums, customer satisfaction ratings, regional behavior, and monthly patterns—all inside one professional dashboard. Whether you manage small claims or large international portfolios, this dashboard helps you stay in control at all times.
Let’s explore why this product is the best solution for insurance analytics.
🌟 Key Features of Insurance Claim Dashboard in Power BI
1️⃣ Overview Page – High-Level Performance Snapshot 🧭
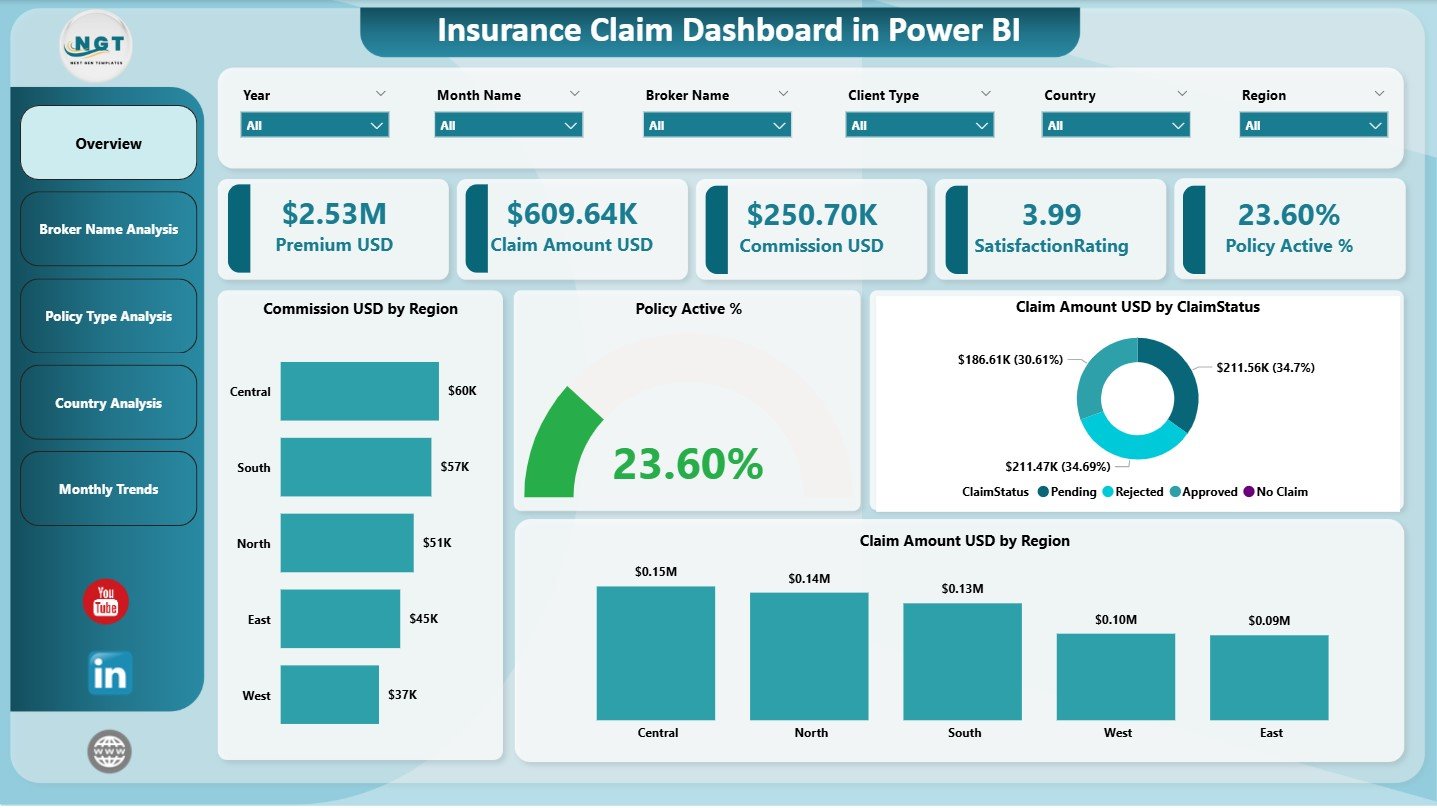
The Overview Page works as the command center of the dashboard. It displays five powerful KPI cards:
-
Policy Active %
-
Total Claim Amount (USD)
-
Commission Amount (USD)
-
Number of Claims
-
Overall Satisfaction Rating
Below the cards, you get four essential visuals:
-
Policy Active %
-
Claim Amount by Claim Status
-
Commission by Region
-
Claim Amount by Region
With these visuals, insurance teams instantly understand company-wide performance and risk exposure.
📦 What’s Inside the Insurance Claim Dashboard in Power BI
This dashboard includes five interactive pages, each designed to give deeper insights into your insurance operations.
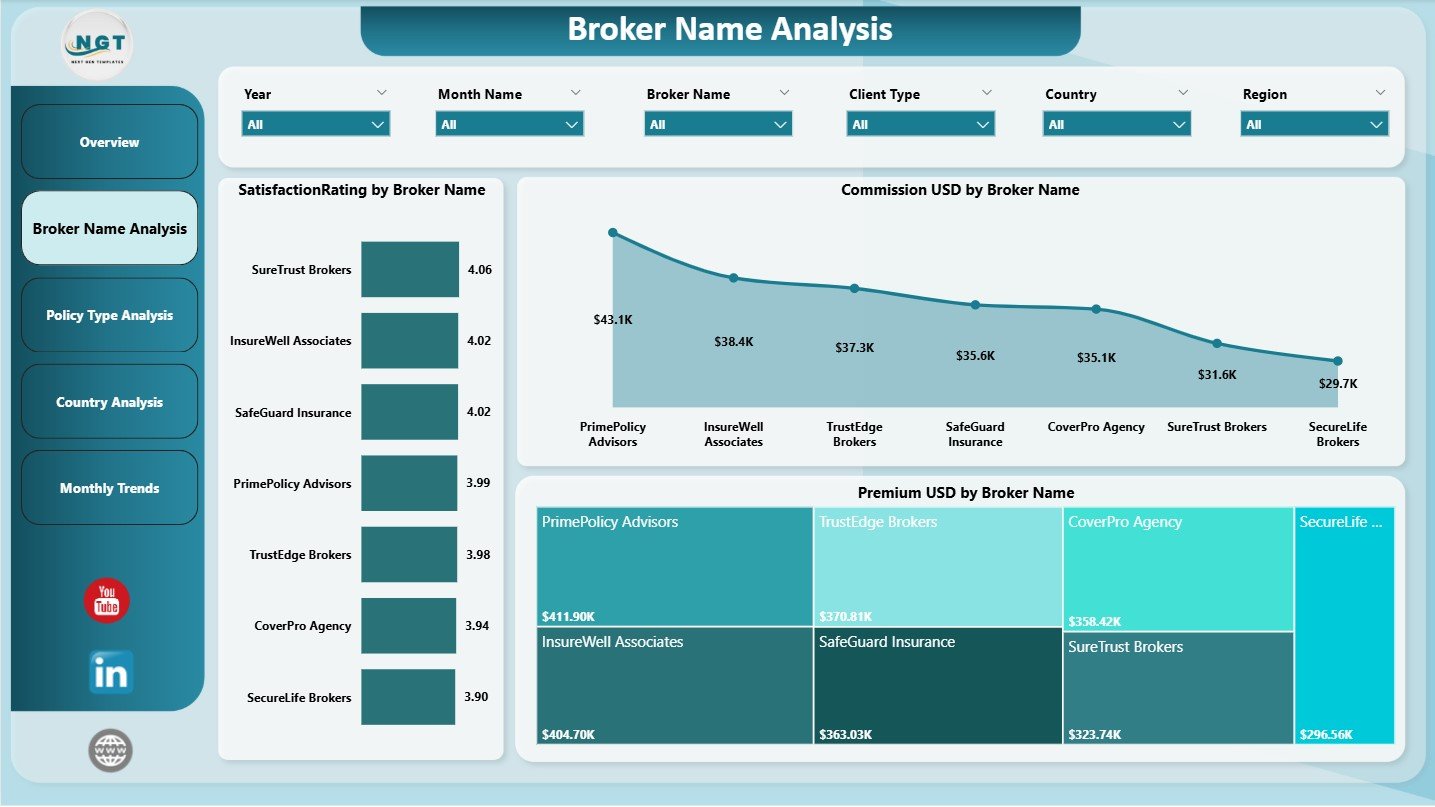
2️⃣ Broker Name Analysis – Identify Top & Low Performers 🤝
Brokers influence sales, claim quality, and customer satisfaction. This page includes:
-
Commission by Broker Name
-
Satisfaction Rating by Broker Name
-
Premium by Broker Name
With this, teams can track broker performance, improve training, reward high performers, and detect issues early.
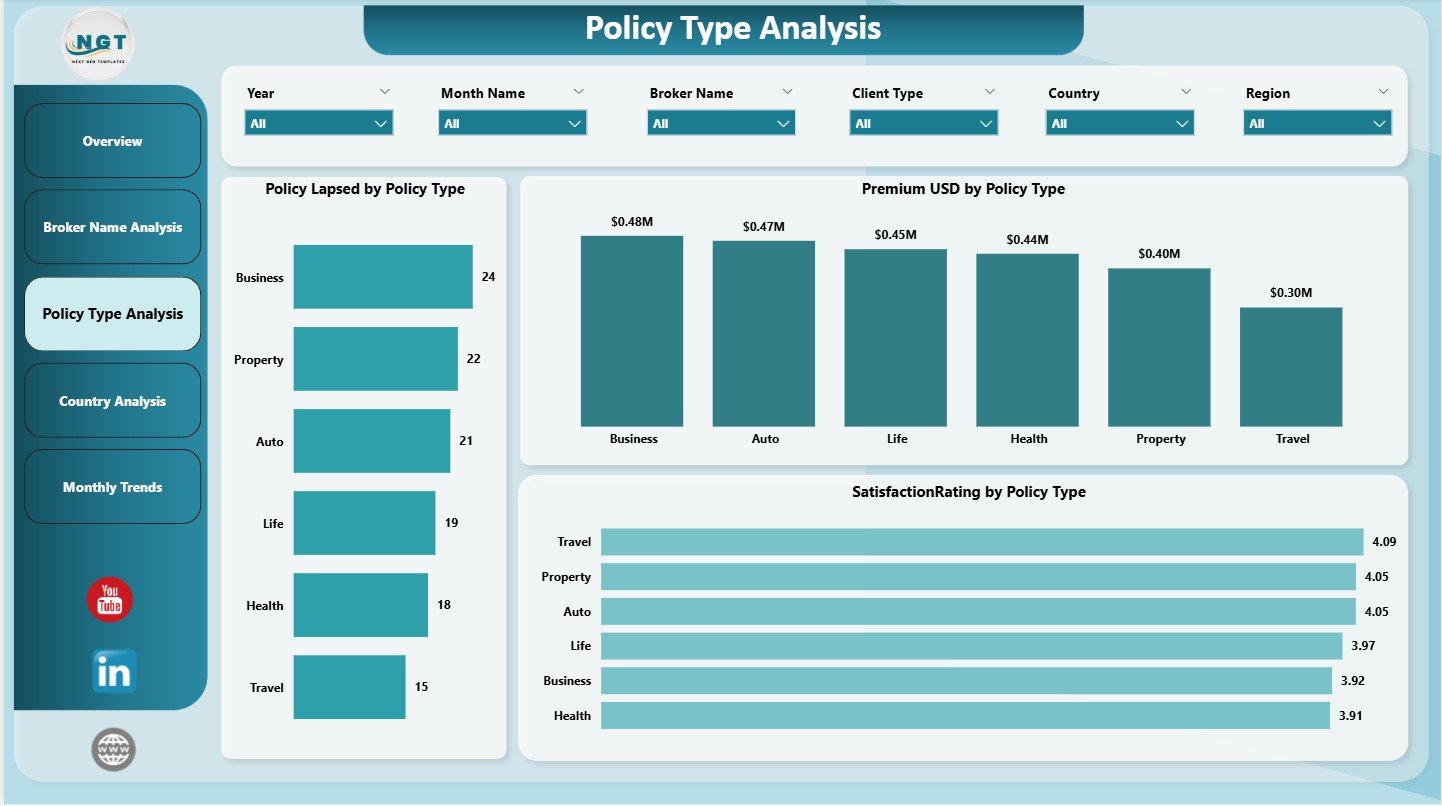
3️⃣ Policy Type Analysis – Understand Your Best Insurance Products 📄
Different policy types generate different revenue, lapses, and customer satisfaction. This page shows:
-
Premium by Policy Type
-
Policy Lapsed by Policy Type
-
Satisfaction Rating by Policy Type
This helps companies strengthen good policies, redesign weak ones, and focus on high-performing plans.
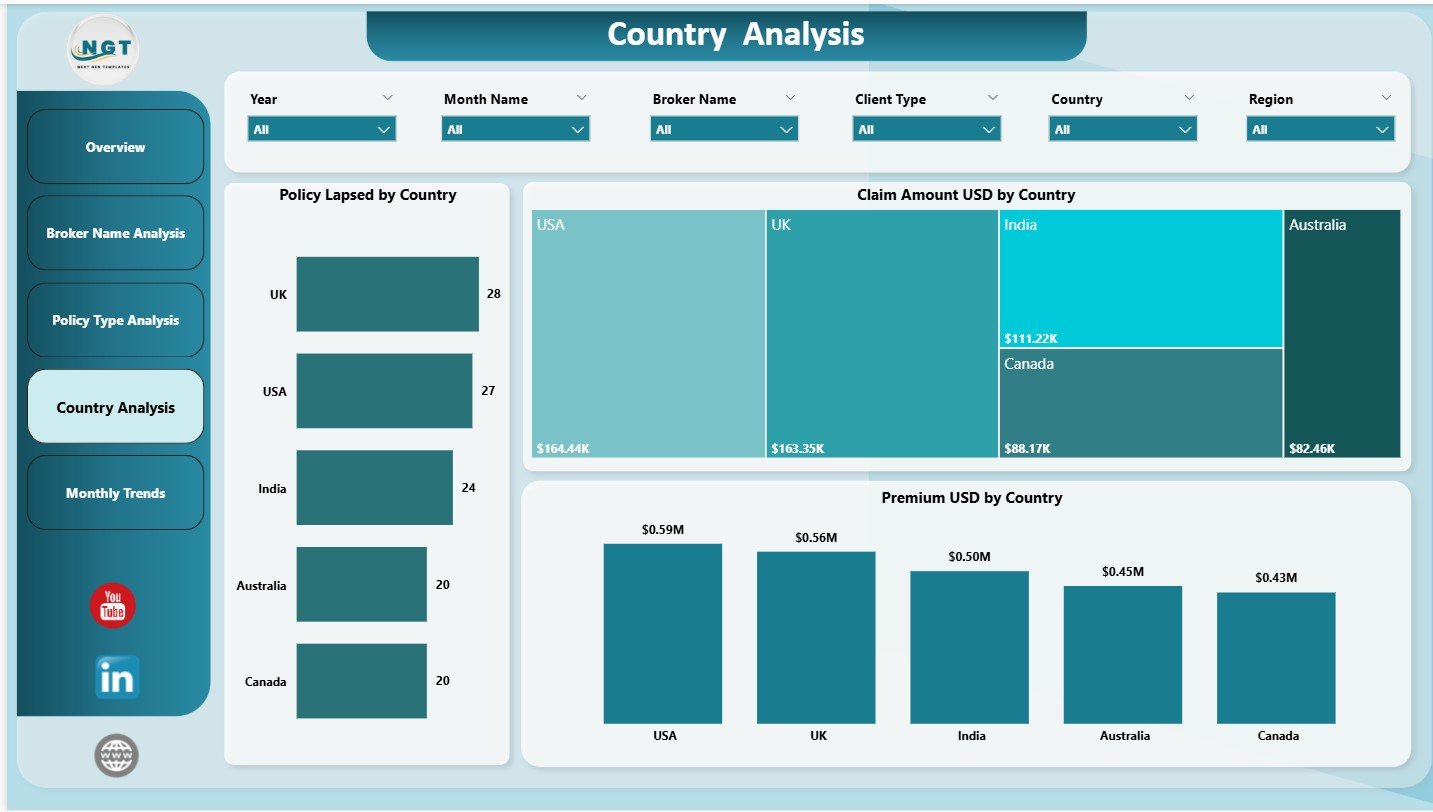
4️⃣ Country Analysis – Geographic Claim Behavior 🌍
Regional insights are vital for risk control and growth strategy. This page displays:
-
Claim Amount by Country
-
Policy Lapsed by Country
-
Premium by Country
With this data, insurance companies can understand high-risk areas, improve local strategies, and reduce fraud.
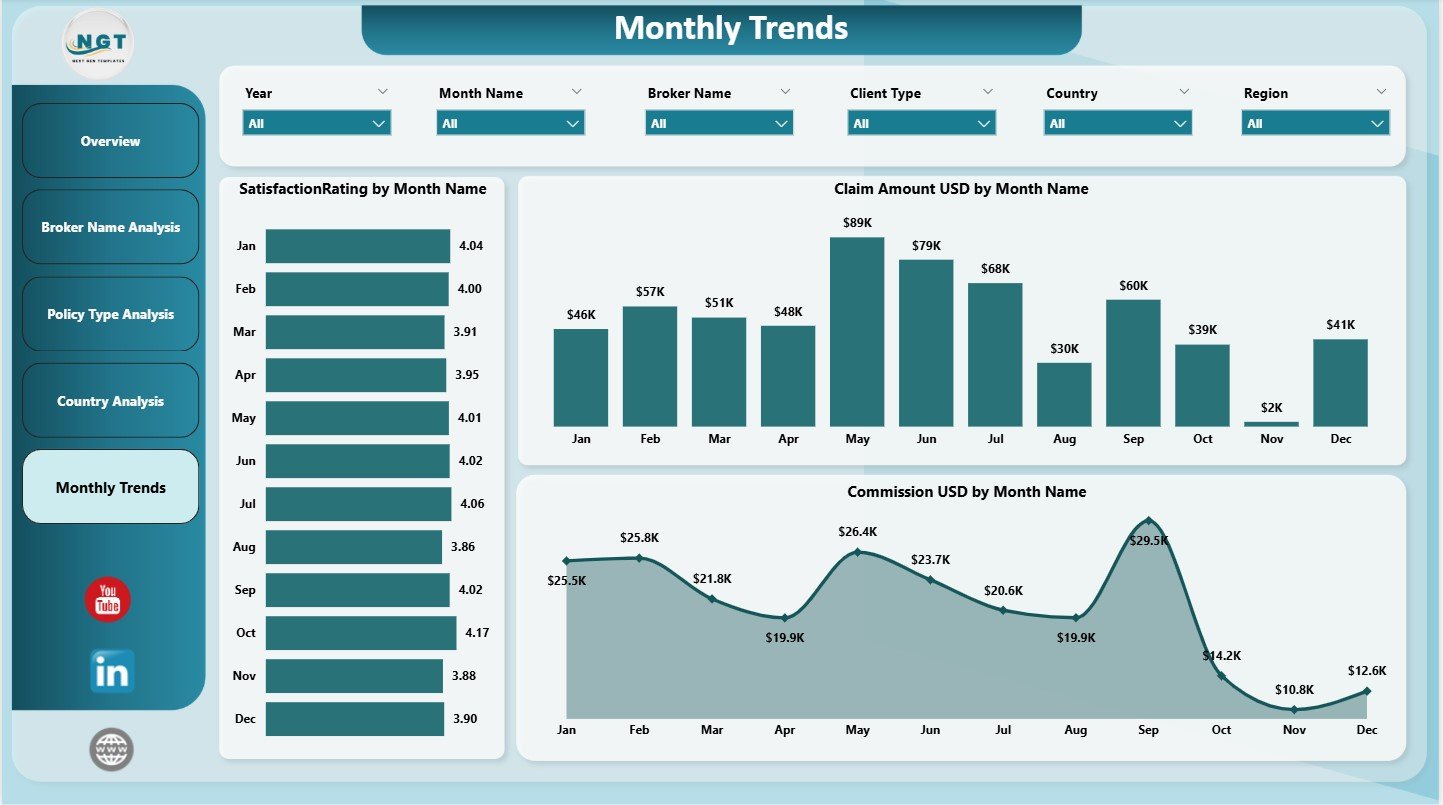
5️⃣ Monthly Trends – Analyze Seasonal Claim Patterns 📅
Insurance claims change month-to-month. This page includes three combo charts:
-
Claim Amount by Month Name
-
Satisfaction Rating by Month Name
-
Commission by Month Name
This helps managers detect seasonal claim spikes, monthly satisfaction dips, increases in payouts, and yearly claim cycles.
🛠 How to Use the Insurance Claim Dashboard in Power BI
Using this dashboard is extremely simple—even for beginners.
1️⃣ Collect data from claims, brokers, policies, and regions.
2️⃣ Clean and transform data using Power Query.
3️⃣ Build relationships between Claims, Broker, Policy, Region, and Calendar tables.
4️⃣ Create DAX measures for totals, counts, averages, satisfaction, and percentages.
5️⃣ Design each page with KPI cards, charts, and slicers.
6️⃣ Refresh data regularly to maintain real-time accuracy.
The dashboard is fully dynamic—once the data is updated, all visuals refresh automatically.
👥 Who Can Benefit from This Insurance Claim Dashboard?
🛡️ Insurance Managers
Track claims, lapses, commissions, and satisfaction instantly.
🤝 Broker Teams
Monitor performance and improve client relationships.
📊 Data Analysts & BI Teams
Use clean visuals for accurate reporting and forecasting.
🏢 Insurance Company Leadership
Get high-level insights for strategy and planning.
💼 Customer Service Teams
Identify customer issues using satisfaction and claim status insights.
This dashboard is perfect for companies of all sizes—from small agencies to large insurance corporations.


Reviews
There are no reviews yet.