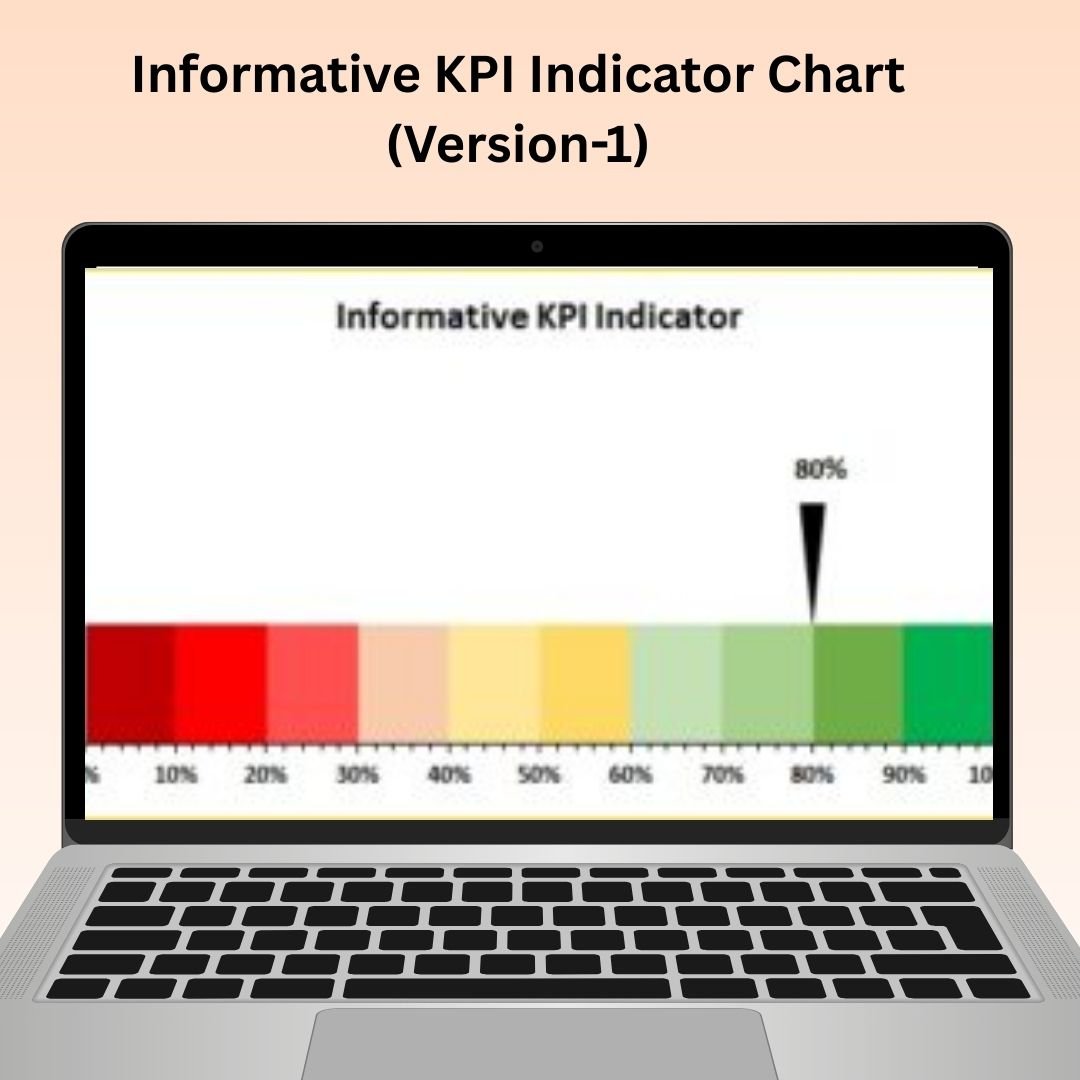
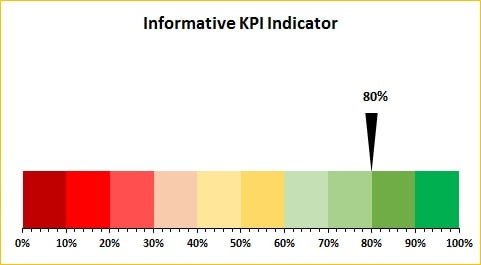
The Informative KPI Indicator Chart Version 1 in Excel is a powerful tool designed to help businesses and teams monitor and visualize their Key Performance Indicators (KPIs) in a clear, informative, and dynamic way. This chart integrates visual elements such as progress bars, arrows, and color-coding to represent the performance of various metrics, making it easy to interpret and communicate the status of key business objectives.
Whether you’re tracking sales figures, project milestones, or any other important KPI, this tool provides a visual, intuitive display of progress against goals. The design is fully customizable, allowing you to tailor the chart to fit your specific business or team needs, whether for reports, presentations, or dashboards. The KPI Indicator Chart is ideal for managers, analysts, and decision-makers who need to stay on top of performance metrics and ensure timely, data-driven decisions.

Key Features of the Informative KPI Indicator Chart Version 1:
📊 Dynamic KPI Tracking
Track the progress of multiple KPIs in one consolidated chart, with clear visual indicators showing whether performance is on track, exceeding expectations, or falling short.
📈 Customizable Indicators
Tailor the chart with various visual indicators such as progress bars, arrows, and color coding to suit your specific KPIs and presentation needs.
🔄 Real-Time Updates
As you update your data, the chart automatically adjusts to reflect the new performance levels, giving you an up-to-date view of your key metrics.
🎨 Color-Coded Design
Use color-coding to represent different performance statuses (green for on track, red for below expectations, etc.), making it easy to see where attention is needed.
📅 Ideal for Dashboards and Reports
Perfect for adding to dashboards or performance reports, the chart provides an at-a-glance summary of KPI progress, helping decision-makers stay informed.
Why You’ll Love the Informative KPI Indicator Chart Version 1:
✅ Visualize Performance Clearly – Easily track and communicate the status of your KPIs with visually engaging charts that highlight progress and areas for improvement. ✅ Customizable for Your Business – Adjust the chart’s design, KPIs, and color scheme to align with your specific business objectives or reporting needs. ✅ Real-Time Data Updates – The chart updates automatically with your data, keeping you informed with the latest KPI performance. ✅ Streamline Reporting – Use the chart in reports, presentations, or dashboards to clearly communicate performance metrics to stakeholders. ✅ Easy to Use – The user-friendly design makes it simple to update and adjust the chart, even for those with limited Excel experience.
What’s Inside the Informative KPI Indicator Chart Version 1:
- Dynamic KPI Indicators – Track your KPIs with visual indicators such as progress bars, arrows, and color-coded performance levels.
- Real-Time Updates – The chart automatically adjusts as you modify your data, ensuring up-to-date KPI tracking.
- Customizable Design – Change the colors, sizes, and metrics to match your specific reporting needs.
- Perfect for Dashboards – Use it to create professional, informative dashboards that provide a visual summary of KPI performance.
How to Use the Informative KPI Indicator Chart Version 1:
1️⃣ Download the Template – Get instant access to the Excel file after purchase. 2️⃣ Input Your Data – Enter the values for the KPIs you want to track into the provided Excel sheet. 3️⃣ Customize the Chart – Adjust the chart’s appearance, colors, and design to suit your reporting style. 4️⃣ Track KPI Performance – Watch the chart update automatically as you input new data and analyze KPI progress. 5️⃣ Present and Share – Use the chart in your business reports, presentations, or dashboards to share insights with stakeholders.
Who Can Benefit from the Informative KPI Indicator Chart Version 1:
- Business Analysts
- Project Managers
- Sales Teams
- Marketing Teams
- Operations Managers
- Financial Analysts
- Anyone needing to monitor, track, and report on KPIs effectively
The Informative KPI Indicator Chart Version 1 is an essential tool for businesses looking to track, manage, and communicate the performance of their KPIs. By combining visual elements with real-time data updates, it helps you quickly identify performance trends, areas of success, and areas that need attention.
Click here to read the Detailed blog post
https://www.pk-anexcelexpert.com/informative-kpi-indicator-chart-version-1/


&url=https://nextgentemplates.com/product/informative-kpi-indicator-chart-version-1/&media=https://nextgentemplates.com/wp-content/uploads/2025/03/Informative-KPI-Indicator-Chart-Version-1-1024x1024.jpg)
&url=https://nextgentemplates.com/product/informative-kpi-indicator-chart-version-2/&media=https://nextgentemplates.com/wp-content/uploads/2025/03/Informative-KPI-Indicator-Chart-Version-2-1024x1024.jpg)
&url=https://nextgentemplates.com/product/spotlight-visualization-in-excel-part-1/&media=https://nextgentemplates.com/wp-content/uploads/2025/03/Spotlight-Visualization-in-Excel-Part-1-1024x1024.jpg)
&url=https://nextgentemplates.com/product/analog-clock-in-excel-pie-chart-doughnut-chart/&media=https://nextgentemplates.com/wp-content/uploads/2025/03/Analog-Clock-in-Excel-Pie-Chart-Doughnut-Chart-1-1.jpg)
&url=https://nextgentemplates.com/product/info-graphics-with-column-chart-part-1/&media=https://nextgentemplates.com/wp-content/uploads/2025/03/Info-graphics-with-Column-chart-Part-1-1024x1024.jpg)
&url=https://nextgentemplates.com/product/info-graphics-with-column-chart-part-2/&media=https://nextgentemplates.com/wp-content/uploads/2025/03/Info-graphics-with-Column-chart-Part-2-1024x1024.jpg)
Reviews
There are no reviews yet.