


In the age of influencer marketing, data is everything. The Influencer Engagement KPI Dashboard in Power BI empowers brands and marketing teams to track influencer performance, measure campaign ROI, and optimize engagement strategies — all in one interactive dashboard.
This ready-to-use Power BI solution centralizes data from multiple sources such as Excel, campaign reports, or APIs, and transforms it into beautiful, actionable visuals. It eliminates manual reporting, ensures real-time accuracy, and gives you a clear picture of which influencers and campaigns truly deliver results.
✨ Key Features of the Influencer Engagement KPI Dashboard in Power BI
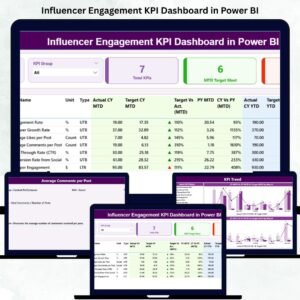
✅ 📊 Summary Page – Your Performance Snapshot
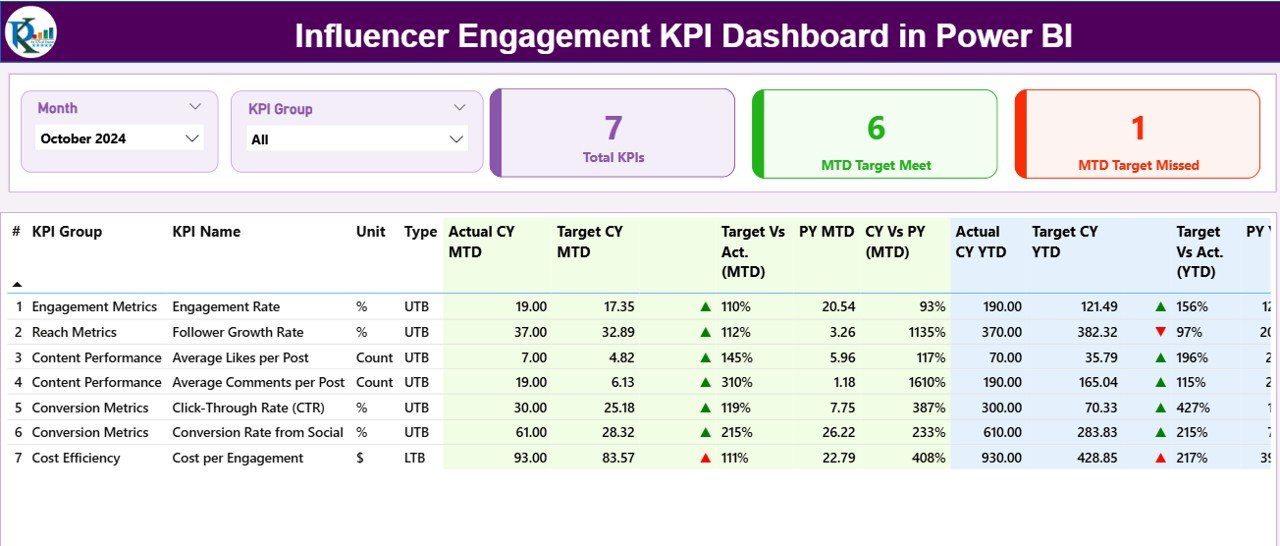
View all influencer KPIs in one place with interactive slicers and automated visual indicators.
-
KPI Cards: Total KPIs, MTD Target Met, MTD Target Missed
-
Dynamic KPI Table: Displays Actual vs Target, MTD and YTD growth, PY comparison, and performance icons (▲/▼).
Perfect for marketing leaders who need an instant overview of influencer success metrics.
✅ 📈 KPI Trend Page – Track Growth Over Time
Visualize month-to-month and year-to-date trends through combo charts comparing Actual vs Target vs Previous Year data.
Spot seasonality, campaign spikes, and influencer consistency with interactive filters by KPI name.
✅ 📘 KPI Definition Page – Clarity and Transparency
Drill-through access to each KPI’s formula, definition, and type (UTB or LTB).
This ensures uniform understanding across the marketing team and improves data transparency.
✅ 💡 Excel Integration
Easily connect to structured Excel files for data updates. The dashboard pulls data from:
-
Input_Actual Sheet – Monthly MTD & YTD actuals
-
Input_Target Sheet – Target KPIs for the same period
-
KPI Definition Sheet – KPI formula, definition, and grouping
✅ 📈 Automated Insights & Comparisons
Automatically calculates Target vs Actual performance, Year-on-Year Growth, and MTD/YTD progress, giving you a full view of influencer ROI in seconds.
✅ 🔄 Real-Time Data Refresh
Refresh with one click — all visuals update instantly to reflect new campaign data.
✅ 🎯 Smart Performance Indicators
Green ▲ icons mark KPIs performing above target; red ▼ icons instantly flag underperformance — enabling quick action.
✅ 🔒 Secure Collaboration
Share dashboards via Power BI Service with access control, ensuring secure visibility for executives and clients.
📦 What’s Inside the Influencer Engagement KPI Dashboard
📁 3 Professionally Designed Pages:
1️⃣ Summary Page – Master view of all key influencer KPIs.
2️⃣ KPI Trend Page – Visual performance tracking for short- and long-term results.
3️⃣ KPI Definition Page – Detailed documentation of metrics and formulas.
🧮 Integrated Excel Source Files:
-
Input_Actual.xlsx – Contains all actual data values.
-
Input_Target.xlsx – Holds monthly and yearly target benchmarks.
-
KPI_Definition.xlsx – Lists metric formulas, descriptions, and UTB/LTB status.
💡 Designed for scalability — you can easily add new KPIs, influencers, or campaigns.
⚙️ How to Use the Influencer Engagement KPI Dashboard
1️⃣ Prepare and update your Input_Actual and Input_Target Excel sheets monthly.
2️⃣ Open the Power BI file and click Refresh to load the latest data.
3️⃣ On the Summary Page, select Month or KPI Group filters for instant insights.
4️⃣ Visit the KPI Trend Page to compare Actual vs Target vs Previous Year.
5️⃣ Use Drill-Through to view KPI definitions and details anytime.
6️⃣ Share interactive dashboards via Power BI Service or export reports in PDF/PPT.
💡 Pro Tip: Use the slicers to compare top influencers or campaigns side-by-side to identify your best performers!
👥 Who Can Benefit from This Dashboard
📣 Marketing Teams – Track influencer and campaign performance at scale.
📱 Brand Managers – Monitor engagement rates, reach, and ROI across platforms.
💼 Agency Owners – Centralize influencer data for multiple clients.
📊 Data Analysts – Simplify performance tracking with built-in metrics and visuals.
💡 Social Media Managers – Identify top-performing influencers and allocate budgets effectively.
🧩 Executives & Decision Makers – Gain high-level insight into marketing ROI in seconds.
This Power BI dashboard helps every stakeholder move from guesswork to strategy — turning data into smarter influencer engagement decisions.
🔗 Click here to read the Detailed Blog Post
🎥 Visit our YouTube channel to learn step-by-step video tutorials


Reviews
There are no reviews yet.