
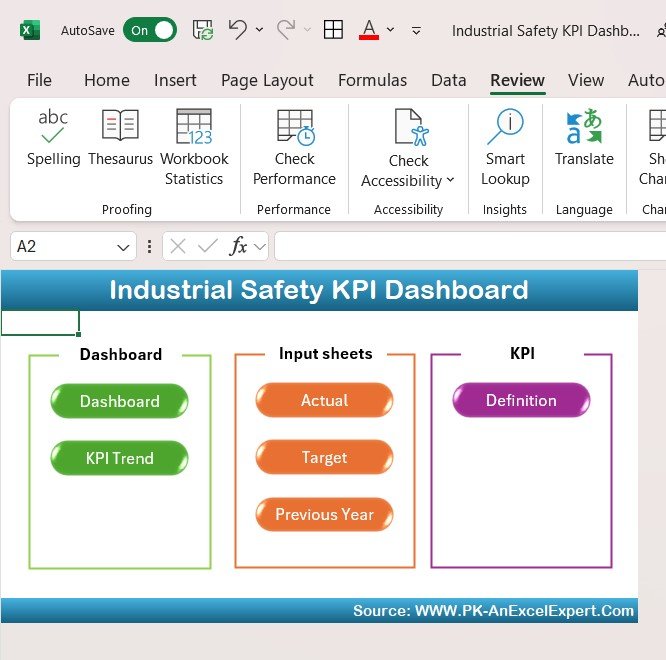


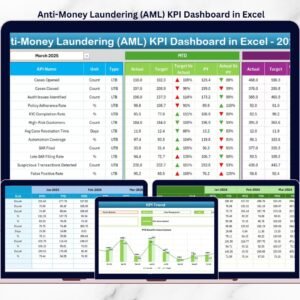
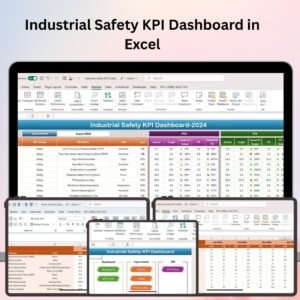
The Industrial Safety KPI Dashboard in Excel is a vital tool designed for safety managers, HR professionals, and operations teams to track and monitor workplace safety in industrial environments. This Excel-based dashboard enables you to measure key performance indicators (KPIs) such as accident frequency, injury rates, safety inspections, and training effectiveness, helping you ensure a safe and compliant working environment.
With easy-to-read visualizations, real-time tracking, and customizable features, this dashboard helps you stay on top of safety performance, reduce risks, and improve compliance with safety regulations.

Key Features of the Industrial Safety KPI Dashboard in Excel:
⚠️ Safety Incident Tracking
Track workplace incidents, including accidents, injuries, near misses, and property damage, to monitor safety trends and identify areas for improvement.
📊 Injury and Accident Rates
Monitor injury rates, accident frequency, and lost time due to injuries, helping you evaluate the effectiveness of your safety initiatives and reduce workplace accidents.
🔍 Safety Inspections and Audits
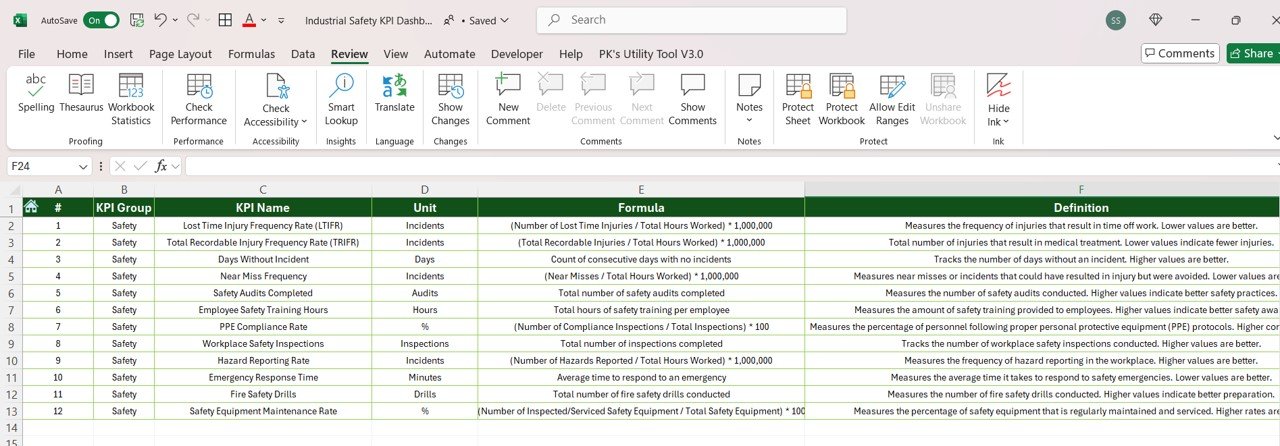
Track the completion of safety inspections, audits, and compliance checks, ensuring that safety standards are consistently met and risks are minimized.
💼 Safety Training Monitoring
Track safety training sessions, certifications, and employee participation, ensuring that your workforce is properly trained to handle safety challenges.
📈 Compliance and Risk Assessment
Evaluate safety compliance levels and assess potential risks to prevent accidents and injuries, ensuring that all safety regulations are followed.
🚀 Why You’ll Love the Industrial Safety KPI Dashboard in Excel:
✅ Monitor Workplace Safety – Track safety incidents, accident rates, and injuries to identify trends and prevent future incidents.
✅ Improve Safety Compliance – Monitor safety inspections and audits to ensure compliance with industry safety standards and regulations.
✅ Track Safety Training – Keep track of safety training sessions, certifications, and employee participation to ensure that everyone is properly trained.
✅ Analyze Injury and Accident Data – Measure accident frequency, injury rates, and lost time to assess the effectiveness of safety initiatives and improve safety performance.
✅ Fully Customizable and Interactive – Fully customizable to fit your industry’s needs, with interactive charts and real-time tracking to make data-driven decisions.
✅ Enhance Employee Safety – Use the data to improve safety practices, reduce workplace injuries, and create a safer work environment.
What’s Inside the Industrial Safety KPI Dashboard in Excel:
-
Incident Tracking: Monitor and track accidents, injuries, near misses, and damage reports, helping you identify safety trends and areas for improvement.
-
Injury and Accident Rates: Track injury rates, accident frequency, and lost work time to evaluate the effectiveness of your safety programs.
-
Safety Inspections and Audits: Track safety inspections, audits, and compliance checks to ensure that your workplace meets all safety standards.
-
Safety Training: Monitor safety training sessions, certifications, and employee participation to ensure that everyone is properly trained and compliant.
-
Compliance and Risk Assessment: Evaluate compliance with safety standards and track potential risks to prevent accidents.
-
Custom Reports: Generate customized reports summarizing safety incidents, training, and compliance to help with decision-making.
How to Use the Industrial Safety KPI Dashboard in Excel:
1️⃣ Download the Template – Instantly access your Excel file upon purchase.
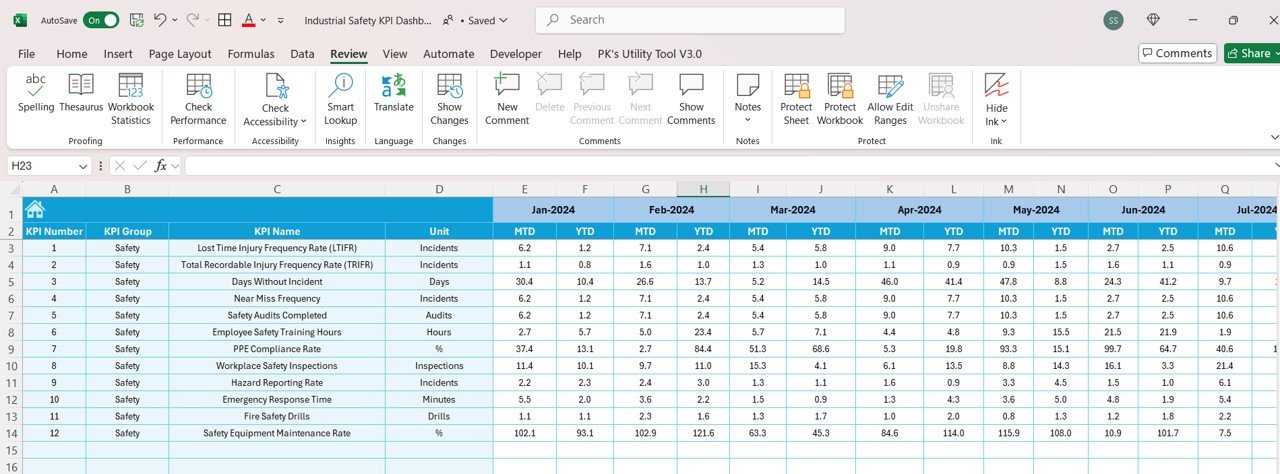
2️⃣ Input Safety Data – Enter data related to incidents, injuries, training sessions, and inspections to start tracking key safety KPIs.
3️⃣ Monitor Safety Performance – Use the dashboard to track safety incidents, accident rates, compliance status, and training participation in real-time.
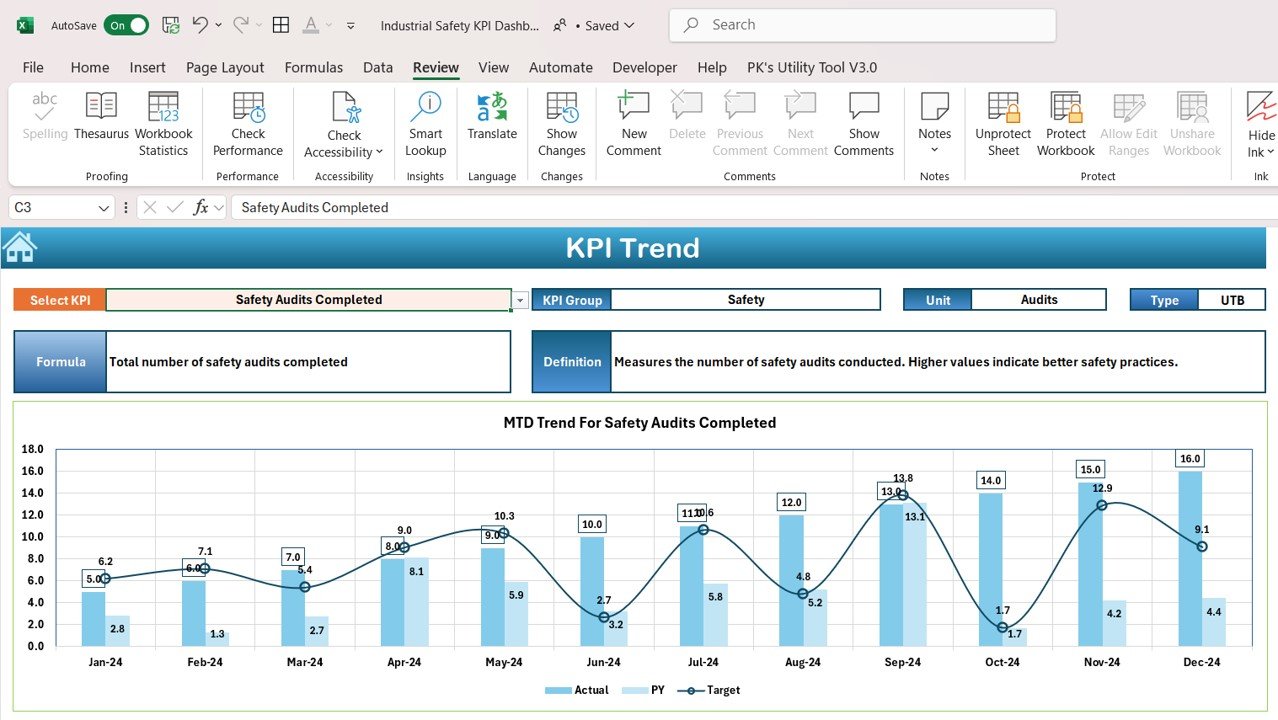
4️⃣ Analyze Safety Trends – Identify trends in incidents, injuries, and accident rates to develop strategies for improving safety.
5️⃣ Generate Reports – Create customized reports summarizing safety performance, inspections, and training effectiveness to support safety improvements.
Who Can Benefit from the Industrial Safety KPI Dashboard in Excel:
-
Safety Managers
-
Industrial Operations Teams
-
HR and Compliance Teams
-
Health and Safety Officers
-
Manufacturing and Production Facilities
-
Warehouse and Logistics Teams
-
Construction Companies
-
Government Regulatory Bodies
The Industrial Safety KPI Dashboard in Excel is an indispensable tool for tracking, analyzing, and improving safety in industrial environments. With features that help you monitor safety incidents, evaluate risk levels, and track training and compliance, this dashboard empowers you to create a safer, more compliant workplace.
Click here to read the Detailed blog post
https://www.pk-anexcelexpert.com/industrial-safety-kpi-dashboard-in-excel/
Visit our YouTube channel to learn step-by-step video tutorials
Youtube.com/@PKAnExcelExpert


Reviews
There are no reviews yet.