

The Hydropower KPI Dashboard in Excel is a comprehensive tool designed to help hydropower plant operators, energy managers, and environmental analysts monitor, track, and optimize the performance of hydropower projects. This customizable Excel dashboard provides real-time insights into critical performance indicators (KPIs) such as energy production, turbine efficiency, water flow, and operational costs, all in one easy-to-use interface.
With this dashboard, you can efficiently manage the performance of your hydropower plant, track energy output, and ensure that operational parameters are being met. The tool helps you make data-driven decisions that improve plant efficiency, reduce downtime, and increase overall energy production.
Key Features of the Hydropower KPI Dashboard in Excel
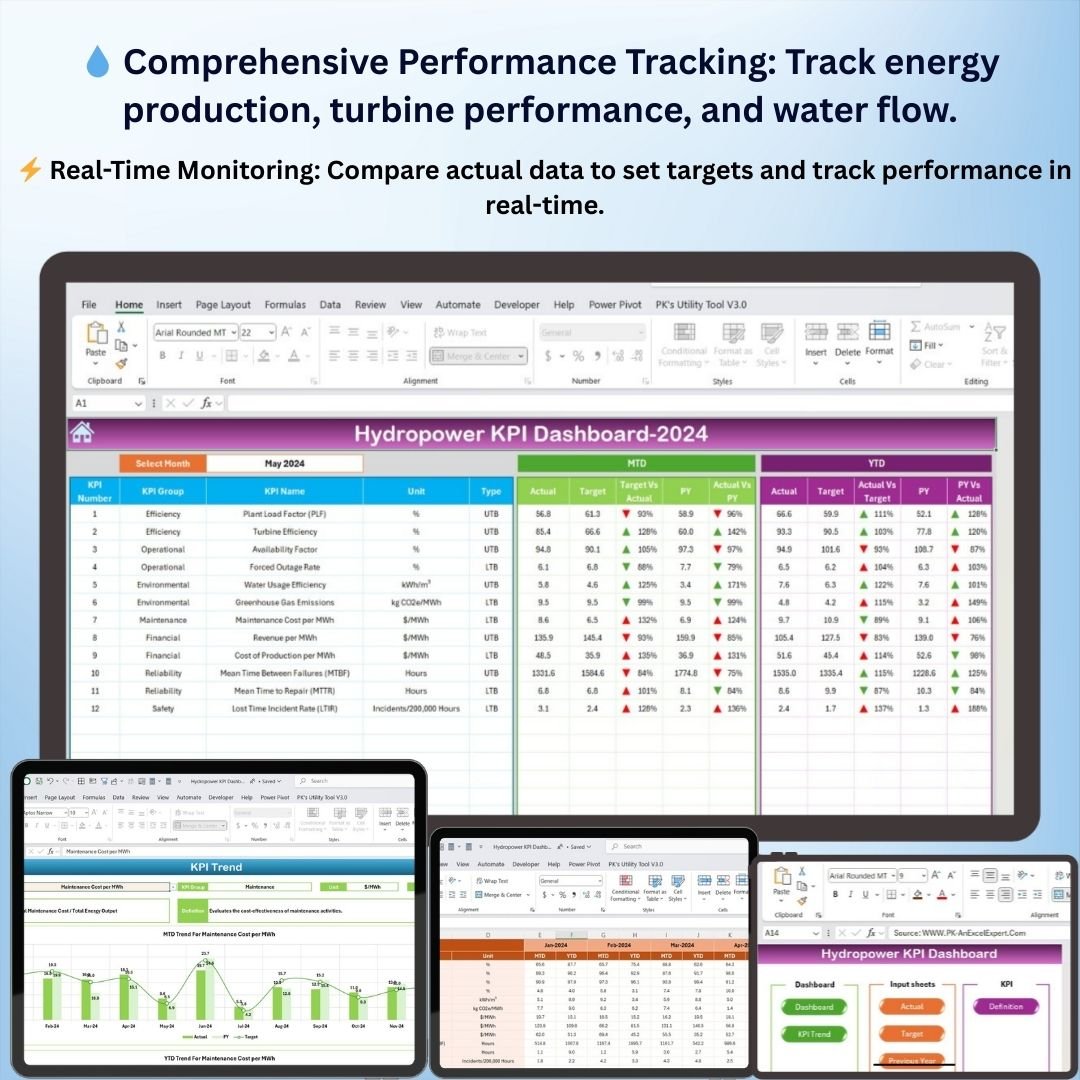
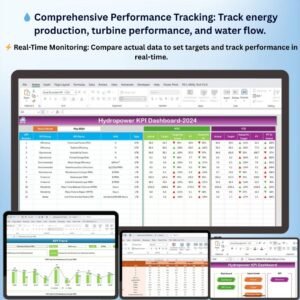
💧 Comprehensive Hydropower Performance Tracking
Track essential KPIs such as energy production, water flow, turbine performance, and operational efficiency. Monitor the health of each turbine and optimize energy generation for maximum efficiency.
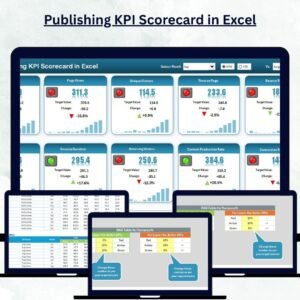
⚡ Real-Time Performance Monitoring
Stay updated on hydropower plant performance in real-time, comparing actual figures against set targets. The dashboard allows you to quickly spot performance issues and take corrective actions to minimize downtime.
📈 Energy Production Insights
Visualize data related to power generation, water usage, and energy output. Use these insights to identify trends, optimize energy production, and enhance the sustainability of your hydropower projects.
📅 Customizable KPIs for Hydropower Plants
Easily adjust the dashboard to track specific KPIs such as turbine efficiency, water flow rates, and generation costs, ensuring that the dashboard meets the unique needs of your hydropower operations.
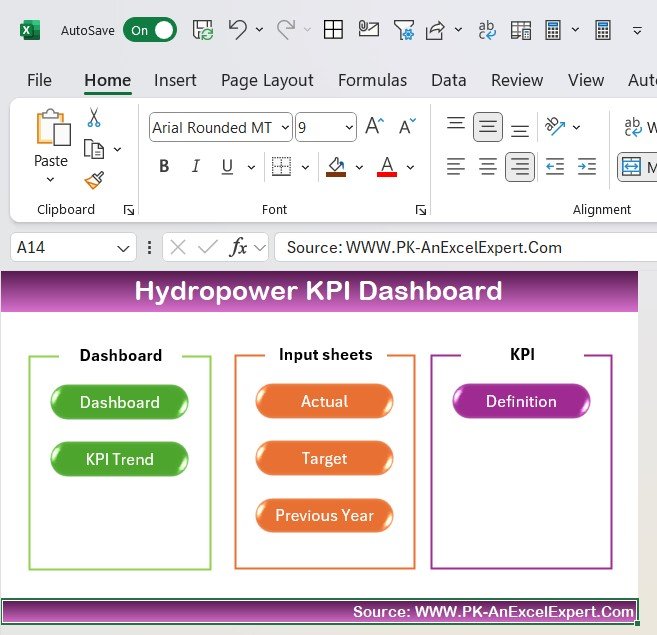
🖥️ Interactive & User-Friendly Interface
The Excel dashboard is designed to be intuitive, allowing you to easily input data, track performance, and analyze trends using interactive charts and graphs.
Why You’ll Love the Hydropower KPI Dashboard in Excel
✅ Track Key Hydropower Metrics
Monitor essential metrics like energy production, water flow, turbine efficiency, and operational costs to ensure optimal plant performance and efficient energy generation.
✅ Optimize Energy Production
Analyze turbine performance and water usage to optimize energy generation and maximize operational efficiency. Use data insights to reduce downtime and improve productivity.
✅ Monitor Operational Efficiency
Use real-time data to track energy output, water usage, and turbine performance, enabling you to identify inefficiencies and areas for improvement in your hydropower plant operations.
✅ Make Data-Driven Decisions
Leverage insights from your hydropower data to make informed decisions about energy production, maintenance schedules, and plant upgrades, ensuring your operations run smoothly.
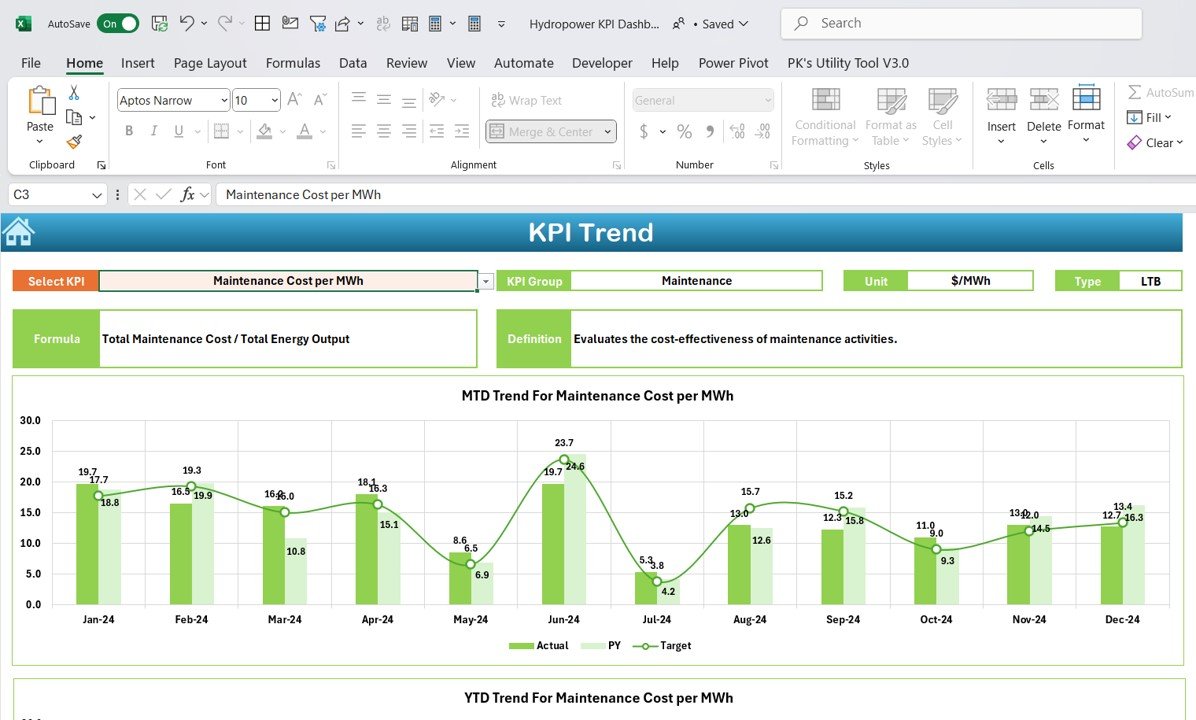
✅ Visualize Trends & Performance
With interactive charts and graphs, easily visualize trends in energy production, water flow, and turbine performance to make quick, data-driven decisions.
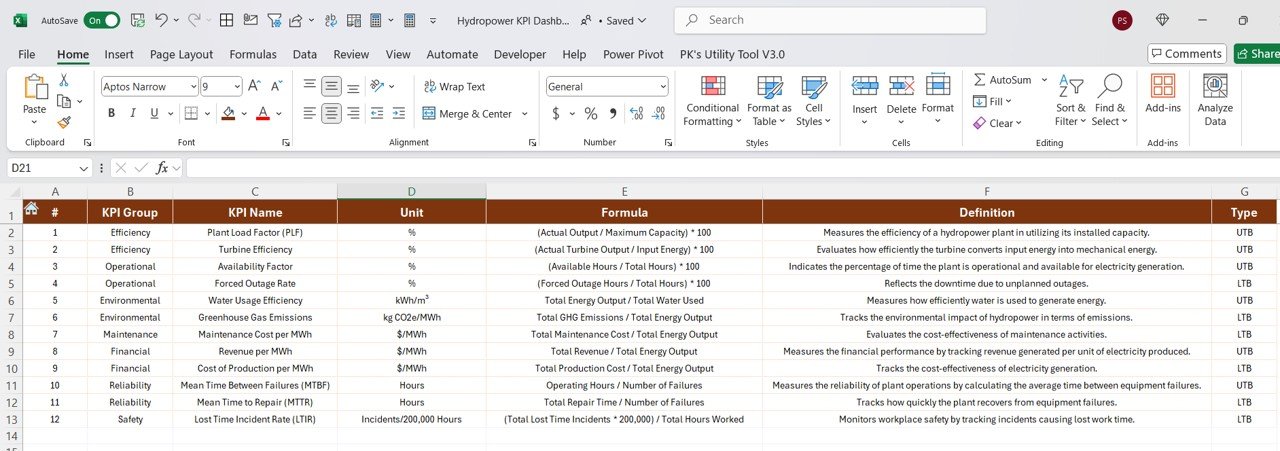
What’s Inside the Hydropower KPI Dashboard Template?
- Energy Production Tracking: Monitor energy output, efficiency, and water usage to assess plant performance.
- Turbine Performance Monitoring: Track turbine performance, efficiency, and operational status to maximize energy generation.
- Water Flow Analysis: Monitor water flow rates and usage to ensure sustainable energy generation.
- Customizable KPIs: Tailor the dashboard to your specific hydropower plant needs.
- Visual Insights: Use interactive charts and graphs to track performance trends and optimize operations.
How to Use the Hydropower KPI Dashboard in Excel
1️⃣ Download the Template: Access the Hydropower KPI Dashboard instantly.
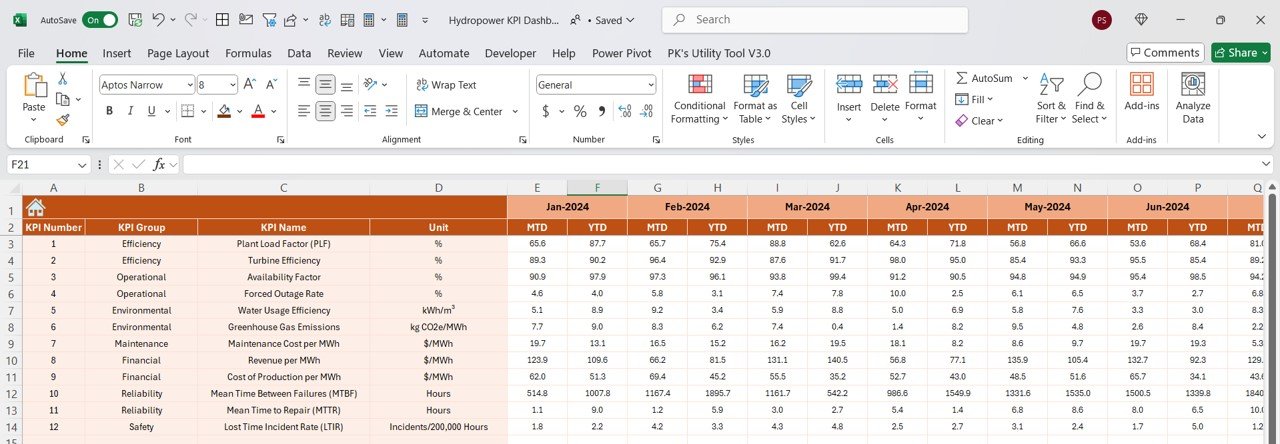
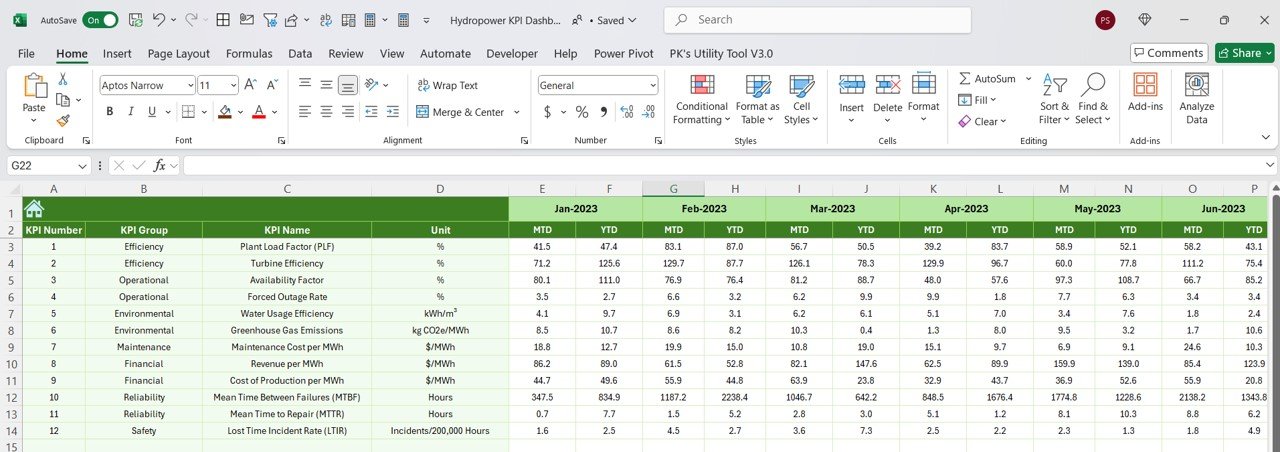
2️⃣ Enter Hydropower Data: Input data such as energy output, water flow rates, and turbine performance metrics.
3️⃣ Track KPIs: Use the dashboard to track performance, monitor trends, and assess energy production in real-time.
4️⃣ Analyze & Optimize: Use the insights to improve energy production, reduce downtime, and enhance operational efficiency.
Who Can Benefit from the Hydropower KPI Dashboard in Excel?
🔹 Hydropower Plant Operators & Energy Managers
🔹 Environmental Analysts & Sustainability Officers
🔹 Renewable Energy Consultants
🔹 Operations Managers in Hydropower Projects
🔹 Anyone Looking to Optimize Hydropower Plant Performance
Track, analyze, and optimize the performance of your hydropower plant with the Hydropower KPI Dashboard in Excel. Monitor key metrics, improve energy production efficiency, and ensure the sustainability of your hydropower operations with this powerful tool.
Click here to read the Detailed blog post
Visit our YouTube channel to learn step-by-step video tutorials
Youtube.com/@PKAnExcelExpert


Reviews
There are no reviews yet.