Humanitarian organizations operate where every decision matters. Food distribution, emergency response, medical support, shelter programs, and education initiatives must be tracked carefully. Humanitarian Aid KPI Dashboard in Excel But when data lives in scattered spreadsheets or manual summaries, leaders struggle to see the full picture.
Missed targets. Delayed insights. Weak donor reporting.
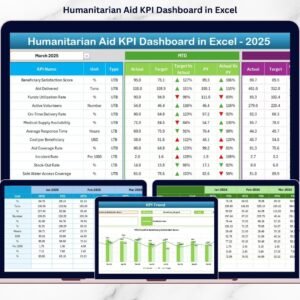
Humanitarian Aid KPI Dashboard in Excel What if you could monitor all your humanitarian KPIs in one powerful, structured, and automated Excel system?
That’s exactly what the Humanitarian Aid KPI Dashboard in Excel delivers. 🚀
Humanitarian Aid KPI Dashboard in Excel This ready-to-use Excel dashboard helps NGOs, aid agencies, and humanitarian teams track Monthly-to-Date (MTD) performance, Year-to-Date (YTD) results, compare Actual vs Target, and analyze Previous Year comparisons — all inside one interactive and easy-to-use workbook.
No expensive BI tools. No complex setup. Just smart, structured performance tracking.
🚀 Key Feature of Humanitarian Aid KPI Dashboard in Excel
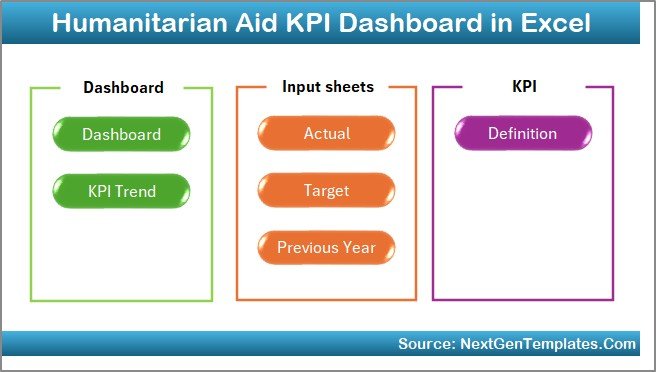
This dashboard includes 7 professionally designed worksheets that work together to provide complete KPI visibility.
🏠 Home Sheet – Smart Navigation Hub
Six structured navigation buttons help you jump instantly to Dashboard, KPI Trend, Input Sheets, Target Sheet, Previous Year Data, and KPI Definition.
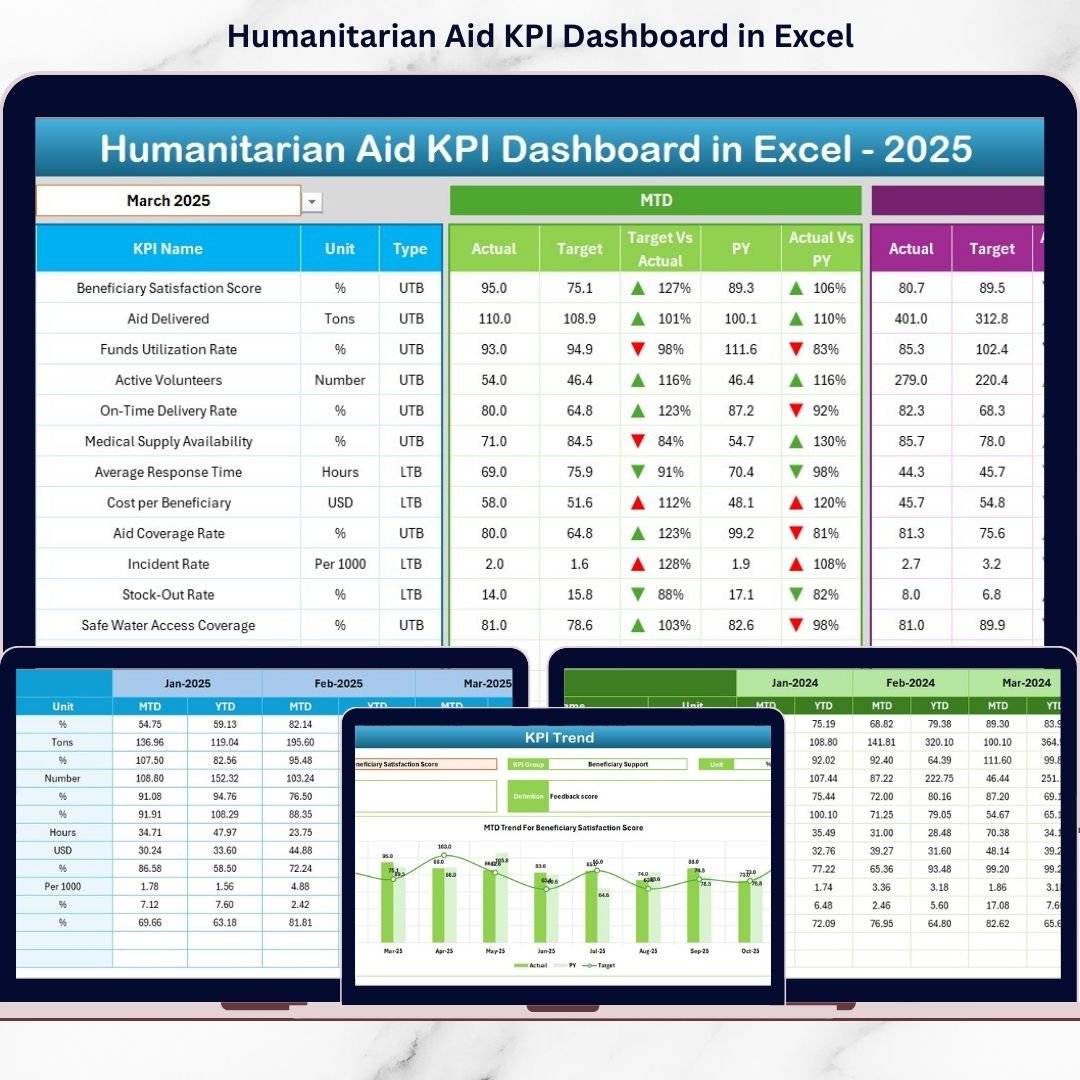
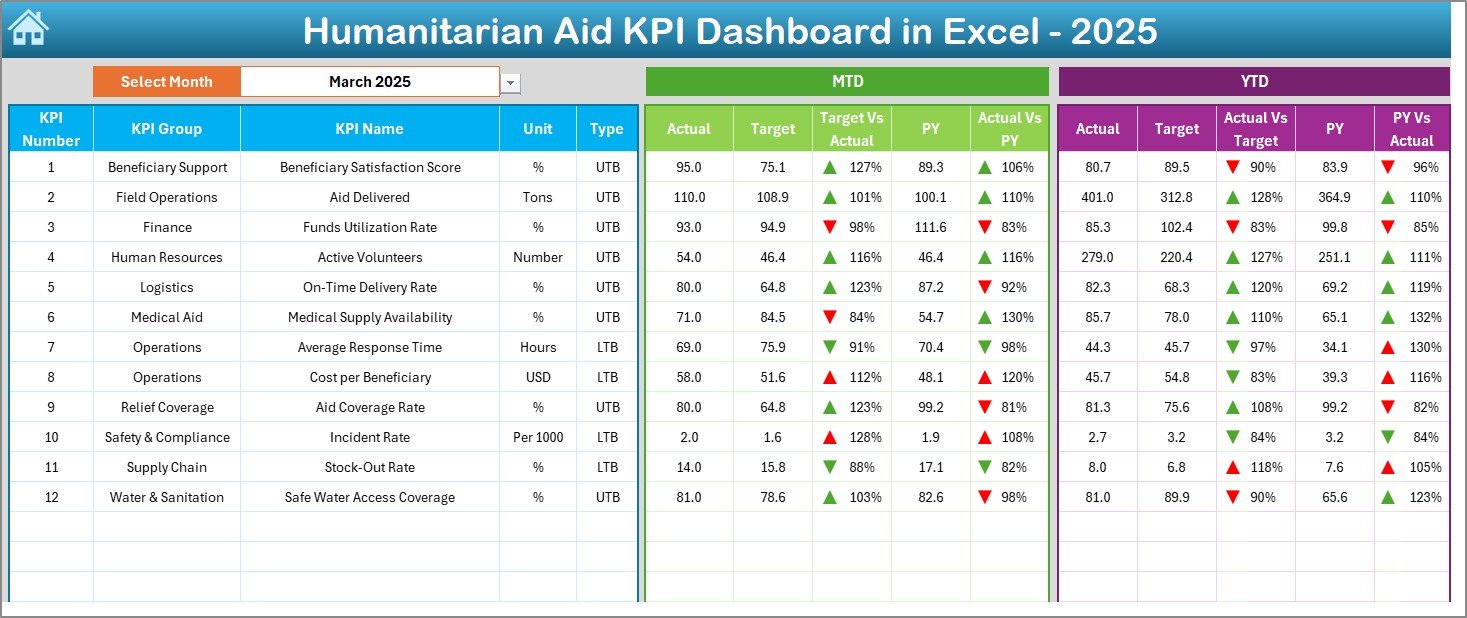
📊 Interactive Dashboard Sheet
Select the Month in cell D3 and watch the entire dashboard update automatically.
✔ MTD Actual vs Target vs Previous Year
✔ YTD Actual vs Target vs Previous Year
✔ Target vs Actual comparison
✔ PY vs Actual comparison
✔ Up/Down conditional formatting arrows
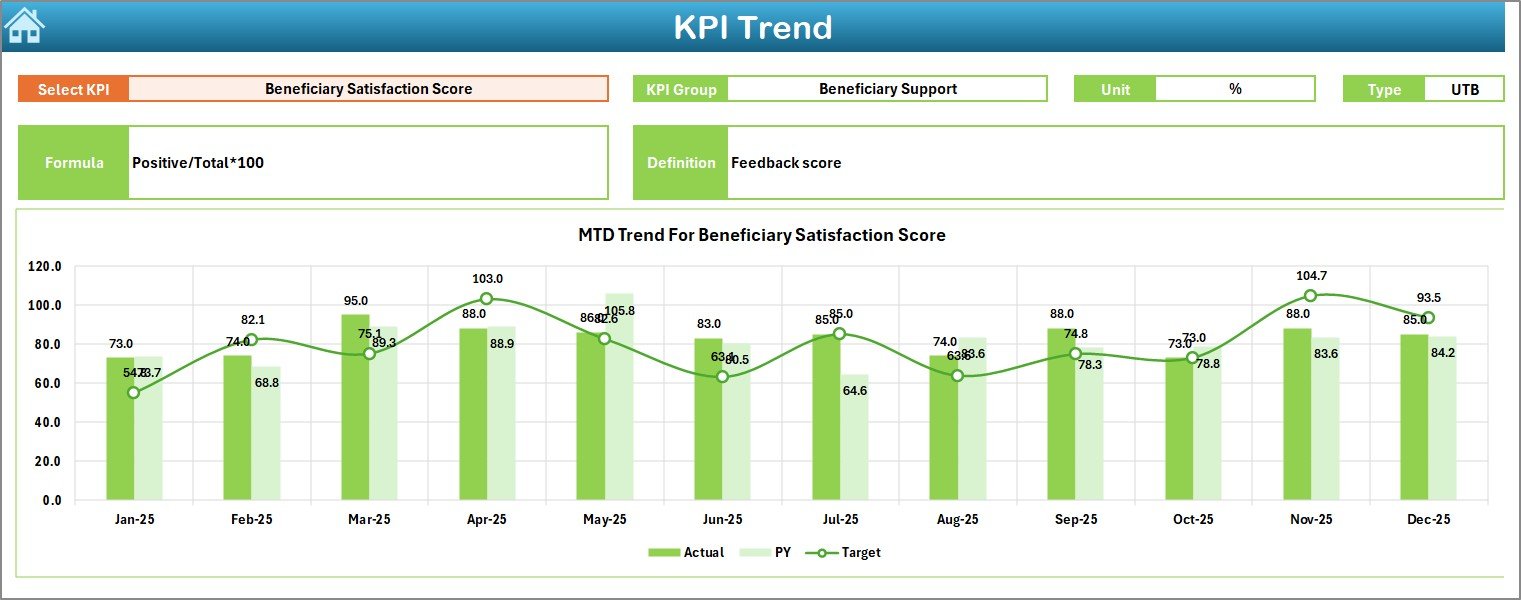
📈 KPI Trend Sheet – Performance Over Time
Select a KPI in cell C3 and analyze:
✔ KPI Group
✔ KPI Type (Lower the Better / Upper the Better)
✔ KPI Formula & Definition
✔ MTD Trend Chart
✔ YTD Trend Chart
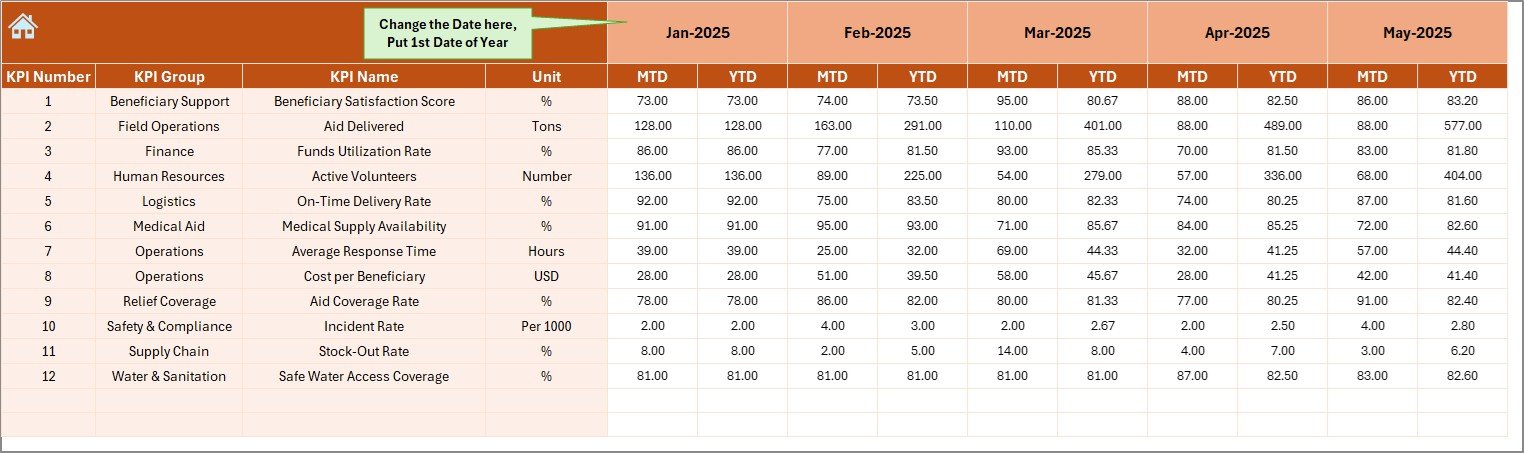
📝 Actual Numbers Input Sheet
Enter MTD and YTD actual values monthly. Calculations update automatically.
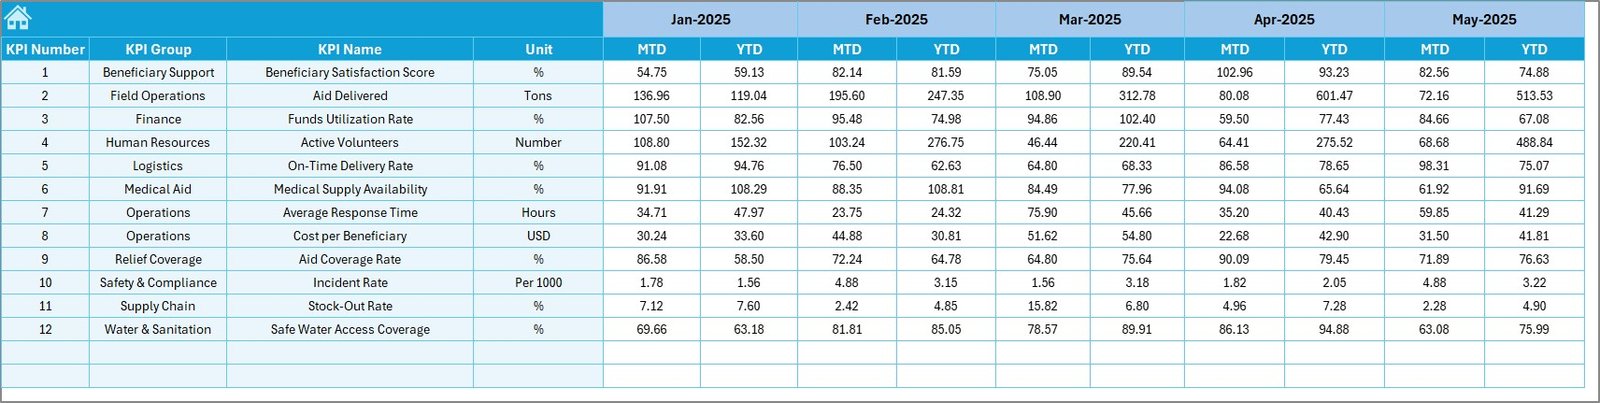
🎯 Target Sheet
Define monthly and yearly targets clearly for structured planning.
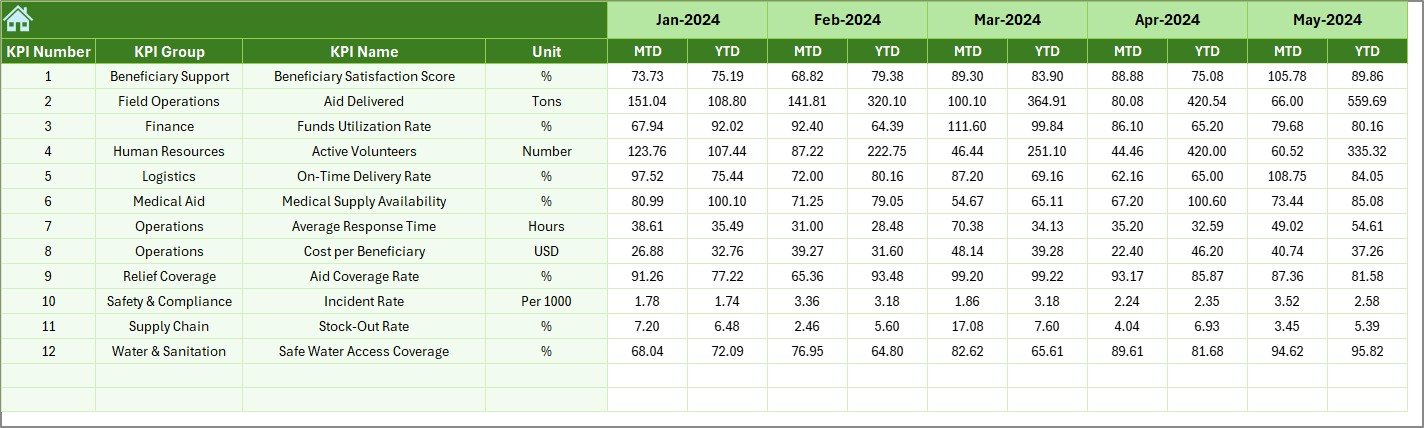
📅 Previous Year Sheet
Enter last year’s data to measure growth and improvement trends.
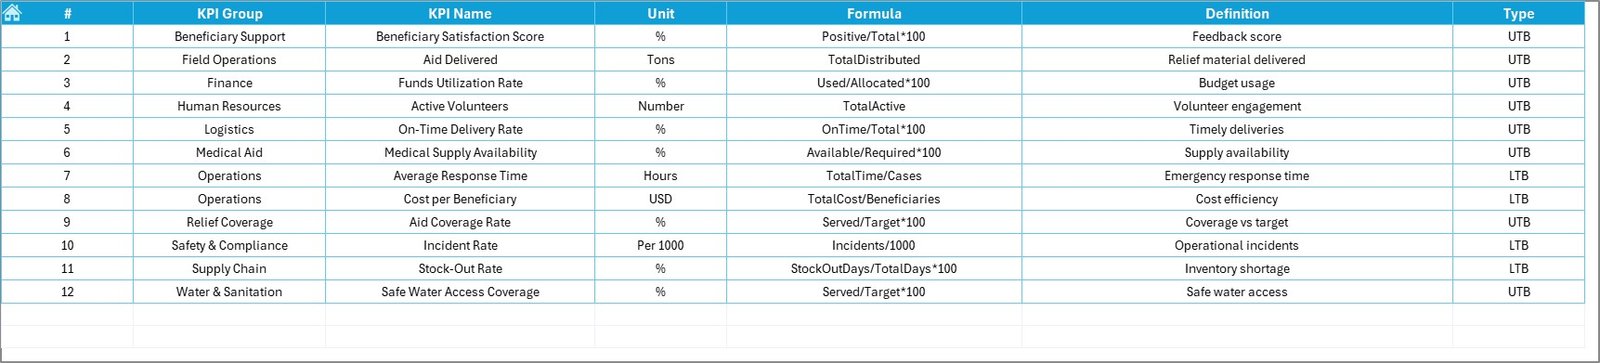
📘 KPI Definition Sheet
Document KPI name, unit, formula, and purpose for governance and transparency.
Everything is connected dynamically. Change the month → performance updates instantly.
📦 What’s Inside the Humanitarian Aid KPI Dashboard in Excel
When you purchase this dashboard, you receive:
✔ 7 fully structured worksheets
✔ Automated MTD & YTD calculations
✔ Actual vs Target comparison system
✔ Previous Year comparison feature
✔ Trend charts for each KPI
✔ Conditional formatting performance arrows
✔ KPI documentation framework
✔ Easy monthly selection control
This is not just a spreadsheet — it’s a complete humanitarian performance management system inside Excel.
🛠 How to Use the Humanitarian Aid KPI Dashboard in Excel
Using the dashboard is simple:
1️⃣ Enter monthly actual data in the “Actual Numbers Input” sheet.
2️⃣ Enter monthly targets in the “Target Sheet.”
3️⃣ Add last year’s numbers in the “Previous Year Sheet.”
4️⃣ Go to the Dashboard sheet.
5️⃣ Select a Month in cell D3.
The dashboard instantly displays:
• MTD performance
• YTD performance
• Target comparison
• Previous year comparison
For detailed KPI analysis:
Go to KPI Trend → Select KPI in cell C3 → Review trend charts and definitions.
No advanced Excel skills required.
🌍 Who Can Benefit from This Humanitarian Aid KPI Dashboard in Excel
This dashboard is ideal for:
🤝 NGOs
🌍 International Aid Agencies
🏥 Health Relief Organizations
🍚 Food Distribution Programs
🏠 Shelter & Rehabilitation Projects
🎓 Education & Child Welfare Programs
📊 Donor Reporting Teams
👩💼 Executive Leadership Teams
Whether you manage small-scale local projects or multi-country humanitarian operations, this dashboard gives you structured visibility.
The Humanitarian Aid KPI Dashboard in Excel helps you:
✔ Improve transparency
✔ Strengthen accountability
✔ Optimize resource allocation
✔ Increase donor confidence
✔ Identify underperformance quickly
✔ Track growth year over year
Instead of reacting to problems late, you take proactive, data-driven decisions.
If your organization wants measurable impact tracking without complex systems, this Excel dashboard provides a practical and powerful solution.
Click here to read the Detailed blog post
Visit our YouTube channel to learn step-by-step video tutorials:
👉 https://youtube.com/@PKAnExcelExpert