


Managing a resort or hotel is more than great service — it’s about smart decisions made with real-time insights. The Hospitality & Resorts Dashboard in Excel is your all-in-one solution to track guests, revenue, costs, and customer satisfaction — all from a single, interactive Excel file.
This ready-to-use dashboard helps hospitality professionals manage performance across departments, resorts, and room types, transforming complex data into simple, visual insights. Whether you operate a luxury resort, a boutique hotel, or a hospitality chain, this Excel tool gives you everything you need to measure efficiency, profitability, and guest experience in one place.
⚙️ Key Features of the Hospitality & Resorts Dashboard in Excel
✅ 📊 Five Analytical Pages – Overview, Department Analysis, Resort Analysis, Room Type Analysis, and Monthly Trends — each designed for powerful visual insights.
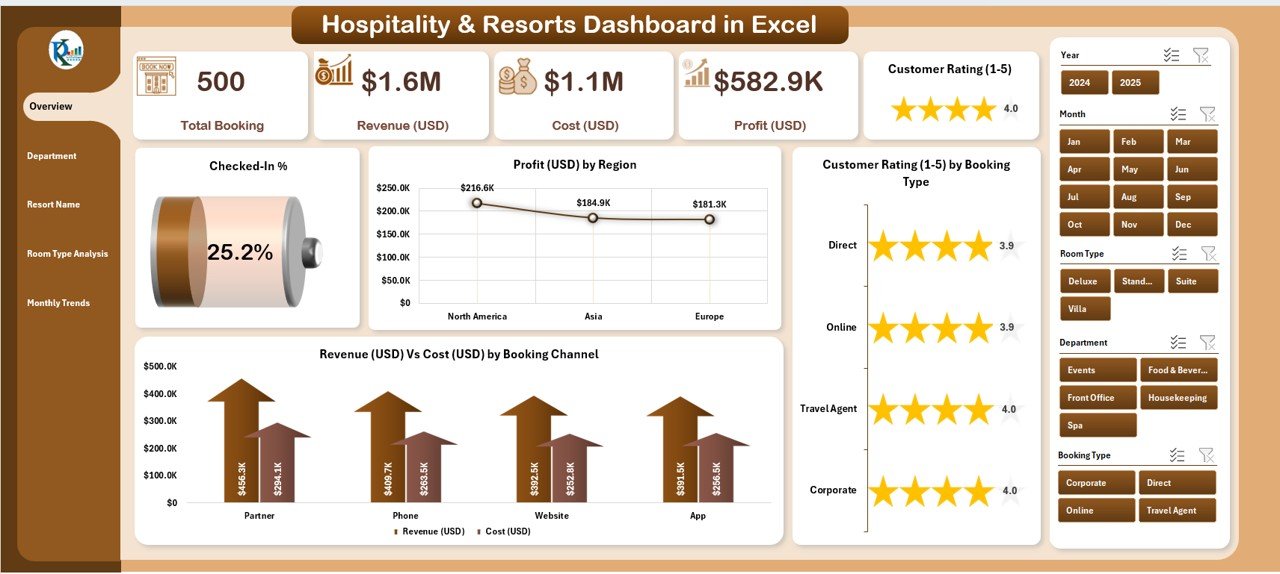
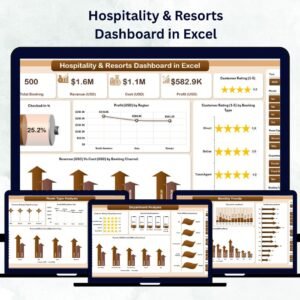
✅ 📋 Overview Page – Get a complete snapshot with five KPI cards: Total Guests, Total Revenue (USD), Total Profit (USD), Check-In %, and Customer Rating Average.
Includes four analytical charts:
-
Check-In %
-
Profit (USD) by Region
-
Customer Rating (1–5) by Booking Type
-
Revenue (USD) Vs Cost (USD) by Booking Channel
✅ 🏢 Department Analysis Page – Analyze Profit, Customer Ratings, Booked %, and Revenue vs Cost for departments like Front Desk, Housekeeping, Food & Beverage, and Spa.
✅ 🏝️ Resort Name Analysis Page – Perfect for multi-location brands! Compare Guest Count, Customer Rating, Profit, and Revenue vs Cost across resorts to spot top-performing properties.
✅ 🛏️ Room Type Analysis Page – Identify the most profitable room categories by tracking Customer Ratings, Profit, Revenue vs Cost, and Booked % by room type.
✅ 📅 Monthly Trends Page – Understand seasonal performance with charts for Profit, Check-In %, Total Bookings, and Revenue vs Cost by Month.
✅ 📂 Support & Data Sheets –
-
Support Sheet: Contains dropdowns and reference data (departments, regions, booking channels, etc.).
-
Data Sheet: Stores raw booking, cost, and rating data that power all visuals.
✅ ⚡ Interactive Filters – Quickly filter by Month, Region, or Booking Type for instant insights.
✅ 🎨 Easy Customization – Modify KPIs, charts, or themes effortlessly — no coding needed!
✅ 💾 Auto-Refresh Enabled – Whenever data changes, all visuals update automatically.
📘 What’s Inside the Hospitality & Resorts Dashboard
📁 Overview Page – Get the complete business snapshot at a glance.
📁 Department Analysis – Evaluate performance and satisfaction by team.
📁 Resort Analysis – Compare branch-level profitability and ratings.
📁 Room Type Analysis – Spot your highest and lowest-performing room types.
📁 Monthly Trends – Visualize seasonal booking and revenue cycles.
📁 Support Sheet – Manage dropdown data lists easily.
📁 Data Sheet – The central data hub for your operations.
Everything is interlinked — enter data once and your entire dashboard updates automatically!
💡 How to Use the Hospitality & Resorts Dashboard
1️⃣ Enter Data: Add booking, cost, and rating details in the Data Sheet.
2️⃣ Update Support Lists: Check departments, booking channels, and room types.
3️⃣ Refresh the Dashboard: Hit refresh to auto-update KPIs and charts.
4️⃣ Use Slicers: Filter by time period, region, or resort to refine analysis.
5️⃣ Review Trends: Navigate pages to assess performance and customer sentiment.
6️⃣ Export Reports: Save or print results as PDFs for management reviews.
You don’t need to be an Excel pro — it’s designed for managers, not coders!
👥 Who Can Benefit from This Dashboard
🏨 Hotel & Resort Managers – Monitor bookings, profitability, and guest experience.
🍽️ Department Heads – Evaluate team performance and satisfaction scores.
📊 Revenue Managers – Compare costs, revenues, and margins.
🌍 Multi-Resort Chains – Benchmark locations to identify top performers.
🏠 Boutique Hotels & Homestays – Scale insights effortlessly with growing data.
💼 Hospitality Analysts & Business Owners – Make informed, data-driven decisions.
Whether you manage one property or a global chain, this Excel dashboard gives you clarity, control, and competitive advantage.
🌟 Why You’ll Love This Dashboard
-
💰 Real-Time Profit Tracking – Monitor margins across departments and resorts.
-
📈 Visual Trend Analysis – Instantly identify seasonal or regional patterns.
-
🌿 Enhanced Guest Experience – Focus on improving ratings and satisfaction.
-
⚙️ Time-Saving Automation – No more manual report building!
-
🧩 Fully Customizable Layout – Adapt KPIs and visuals easily.
-
🧠 Smart Decision Support – Data-backed insights for strategy and planning.
-
📊 Perfect for Excel Users – No extra software required — works offline too!
🔗 Click here to read the Detailed blog post
📺 Visit our YouTube channel to learn step-by-step video tutorials
👉 YouTube.com/@PKAnExcelExpert


Reviews
There are no reviews yet.