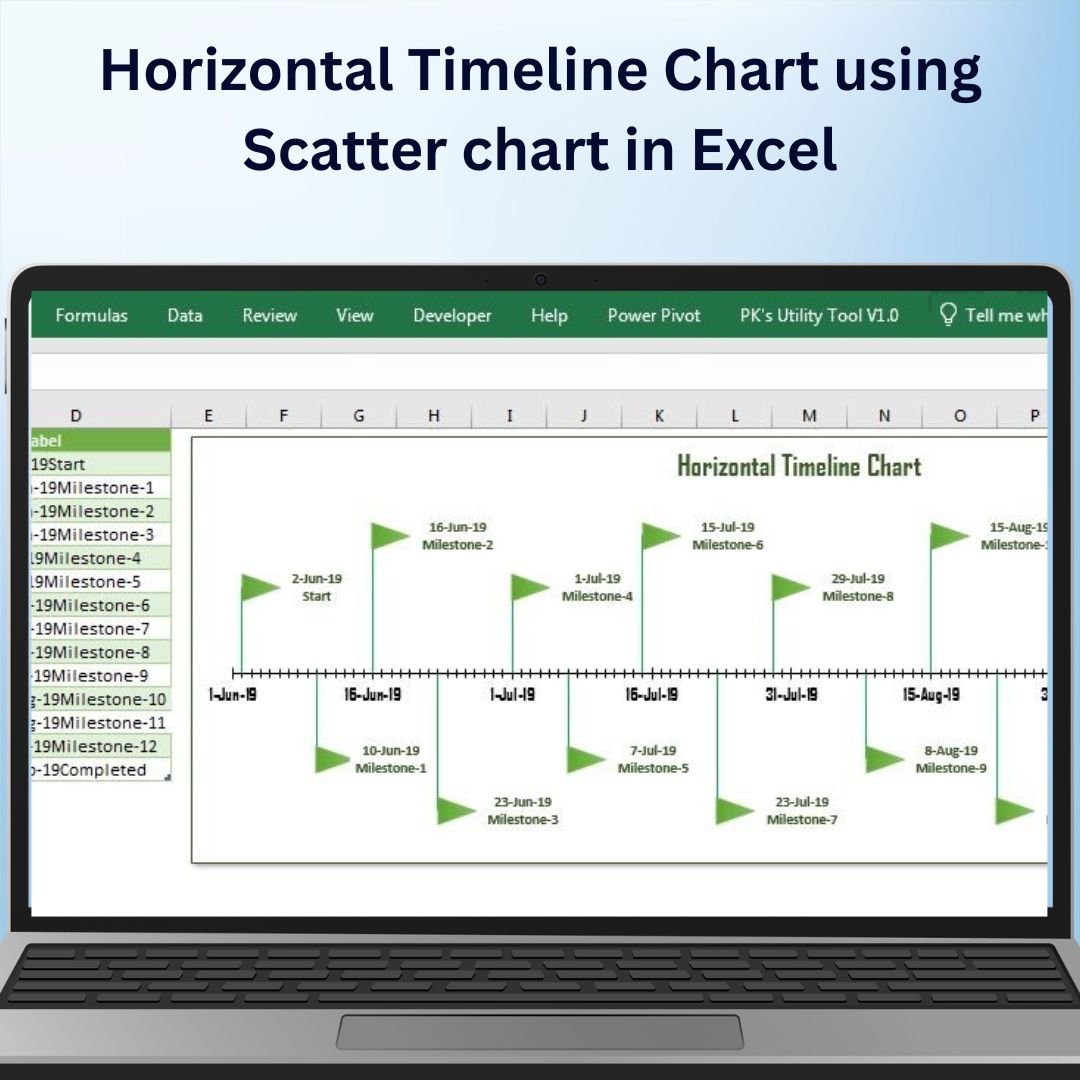
The Horizontal Timeline Chart Using Scatter Chart in Excel is a visually compelling and effective tool to showcase project timelines, milestones, and schedules. Unlike traditional timeline charts, this method uses a scatter chart to represent events or milestones along a horizontal axis, making it a great choice for displaying project progress, historical events, or deadlines. This customizable chart is perfect for project managers, event planners, and anyone looking to visually track and represent timelines in an organized and easy-to-understand format.
The Horizontal Timeline Chart is dynamic, allowing you to update and track changes to your timeline in real-time. With its clean and modern design, the chart ensures your data is presented in a professional, clear, and visually engaging way.
Key Features of the Horizontal Timeline Chart Using Scatter Chart in Excel
📌 Easy-to-Understand Visual Timeline
This chart transforms complex timelines into simple, visually appealing graphics, allowing you to represent key events, milestones, or deadlines along a horizontal axis. It’s perfect for tracking project progress, planning events, or visualizing historical data.
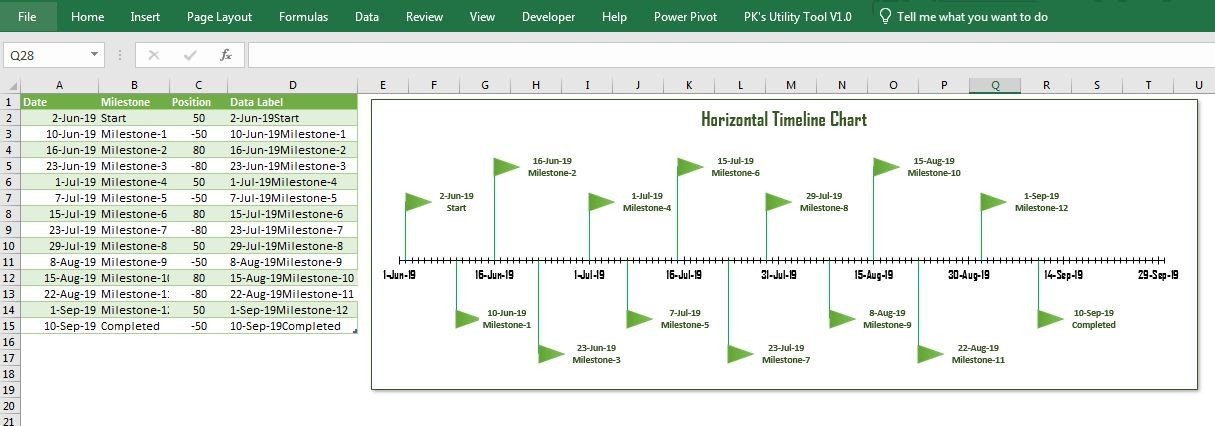
🛠 Scatter Chart for Precise Timeline Representation
The scatter chart allows for accurate placement of milestones and events on a horizontal timeline, giving you a clear view of how various events relate to each other in terms of time.
💡 Customizable Design
You can customize the chart to suit your specific needs. Change colors, add event markers, and modify the chart labels to reflect your particular timeline details. Whether you’re tracking project phases or historical events, the chart adapts to your needs.
🔢 Real-Time Updates
As you update your data, the timeline chart automatically adjusts to reflect the changes in real-time, ensuring that your chart is always up-to-date with the latest information.
🚀 Multiple Event Tracking
This chart allows you to track multiple events or milestones along the timeline. Whether you are planning a project with several phases or tracking important historical events, the scatter chart allows you to visualize them in one cohesive timeline.
📊 Clean and Professional Design
With a clean, minimalist design, the Horizontal Timeline Chart Using Scatter Chart in Excel ensures that your timeline is both professional and easy to interpret. The chart layout is modern and uncluttered, making it suitable for presentations, reports, and other professional uses.
⚙ Simple Setup and Customization
Setting up the timeline chart is simple, even for those with minimal Excel experience. With clear instructions provided, you can customize the chart to fit your timeline details quickly and efficiently.
🚀 Why You’ll Love the Horizontal Timeline Chart Using Scatter Chart in Excel
✅ Clear Timeline Representation – Track and visualize project milestones, deadlines, and events. ✅ Customizable Design – Tailor the chart to reflect your project’s unique phases and events. ✅ Real-Time Updates – Automatically adjust the chart as data is entered or updated. ✅ Multiple Event Tracking – Track and visualize multiple events or milestones in one chart. ✅ Professional Design – A clean, modern design for easy interpretation and presentation.
📂 What’s Inside the Horizontal Timeline Chart Using Scatter Chart in Excel?
- Horizontal Timeline Chart: A visually engaging chart that represents your timeline along a horizontal axis.
- Customizable Event Markers: Easily add milestones and events with customized labels and colors.
- Real-Time Updates: The chart automatically updates as you enter or modify data.
- Clear Setup Instructions: Simple and easy-to-follow steps to set up the chart.
🔍 How to Use the Horizontal Timeline Chart Using Scatter Chart in Excel
1️⃣ Download the Template – Instant access to the Excel file upon purchase. 2️⃣ Input Your Event Data – Enter event dates and details for each milestone. 3️⃣ Customize the Chart – Adjust colors, labels, and markers to reflect your timeline’s events. 4️⃣ Track and Visualize – Use the timeline chart to monitor project progress or showcase historical events. 5️⃣ Present and Share – Share the timeline in reports, presentations, or meetings to highlight key milestones.
🎯 Who Can Benefit from the Horizontal Timeline Chart Using Scatter Chart in Excel? 🔹 Project Managers
🔹 Event Planners
🔹 Educators
🔹 Business Owners
🔹 Historians
🔹 Anyone needing to visualize key events or milestones over time
Track and visualize your project milestones, events, or deadlines with the Horizontal Timeline Chart Using Scatter Chart in Excel. This simple yet powerful tool ensures that your timeline is always up-to-date, visually engaging, and ready to present in any professional setting.
Click here to read the Detailed blog post
https://www.pk-anexcelexpert.com/horizontal-timeline-chart-using-scatter-chart-in-excel/


&url=https://nextgentemplates.com/product/info-graphics-with-column-chart-part-1/&media=https://nextgentemplates.com/wp-content/uploads/2025/03/Info-graphics-with-Column-chart-Part-1-1024x1024.jpg)
&url=https://nextgentemplates.com/product/spotlight-visualization-in-excel-part-1/&media=https://nextgentemplates.com/wp-content/uploads/2025/03/Spotlight-Visualization-in-Excel-Part-1-1024x1024.jpg)
&url=https://nextgentemplates.com/product/info-graphics-with-column-chart-part-2/&media=https://nextgentemplates.com/wp-content/uploads/2025/03/Info-graphics-with-Column-chart-Part-2-1024x1024.jpg)
&url=https://nextgentemplates.com/product/analog-clock-in-excel-pie-chart-doughnut-chart/&media=https://nextgentemplates.com/wp-content/uploads/2025/03/Analog-Clock-in-Excel-Pie-Chart-Doughnut-Chart-1-1.jpg)
&url=https://nextgentemplates.com/product/informative-kpi-indicator-chart-version-1/&media=https://nextgentemplates.com/wp-content/uploads/2025/03/Informative-KPI-Indicator-Chart-Version-1-1024x1024.jpg)
&url=https://nextgentemplates.com/product/informative-kpi-indicator-chart-version-2/&media=https://nextgentemplates.com/wp-content/uploads/2025/03/Informative-KPI-Indicator-Chart-Version-2-1024x1024.jpg)
&url=https://nextgentemplates.com/product/spotlight-visualization-in-excel-part-2/&media=https://nextgentemplates.com/wp-content/uploads/2025/03/Spotlight-Visualization-in-Excel-Part-2.jpg)
Reviews
There are no reviews yet.