Healthcare organizations today face the constant challenge of balancing quality patient care with efficiency and cost control. The Healthcare Services KPI Dashboard in Excel is your all-in-one, ready-to-use solution for turning complex healthcare data into actionable insights. Whether you manage a hospital, clinic, diagnostic center, or multi-specialty network, this dashboard helps you track, analyze, and optimize performance — all inside Microsoft Excel.Healthcare Services KPI Dashboard in Excel
Built with precision and practicality, this template empowers healthcare professionals to monitor Month-to-Date (MTD) and Year-to-Date (YTD) performance across key areas like patient satisfaction, financial health, operational efficiency, and resource utilization. No coding, no complex setup — just plug in your data and watch your results come to life!Healthcare Services KPI Dashboard in Excel
✨ Key Features of Healthcare Services KPI Dashboard in Excel
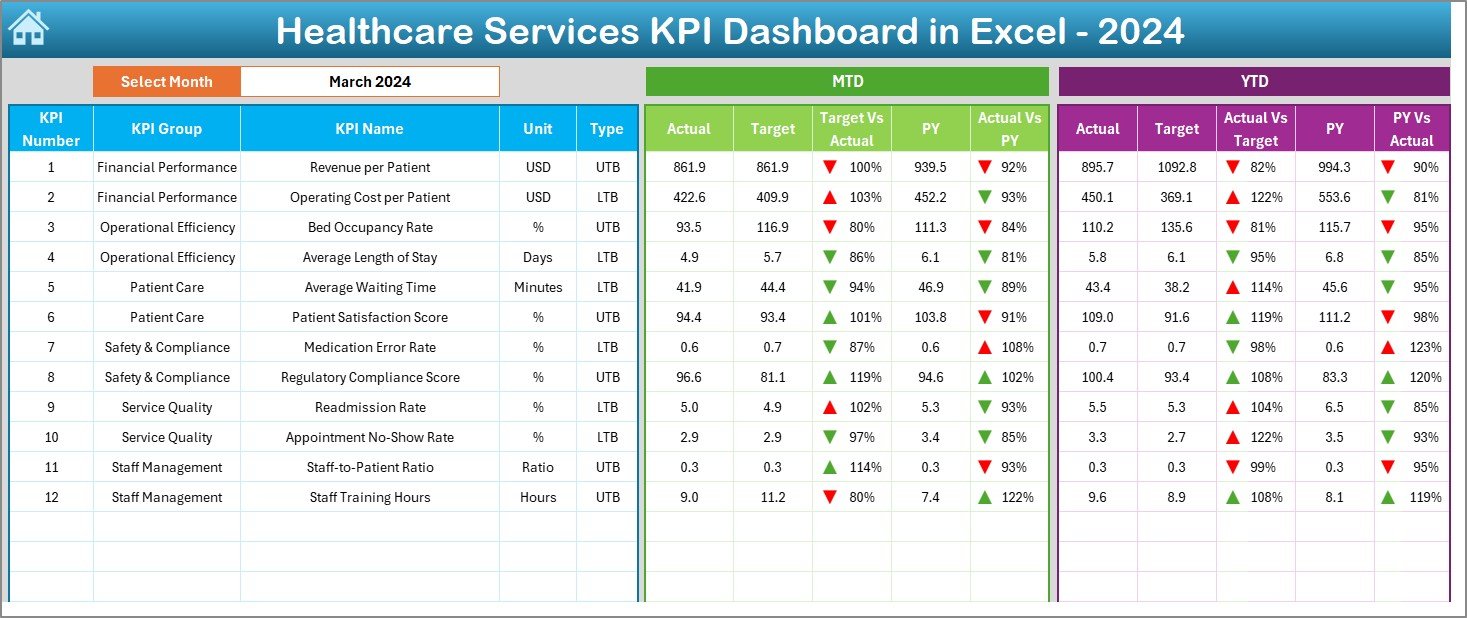
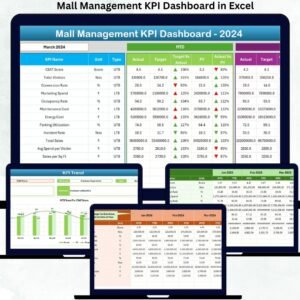
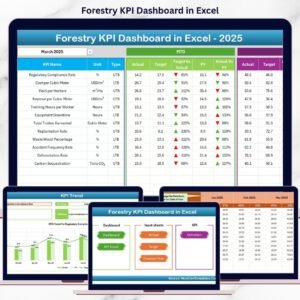
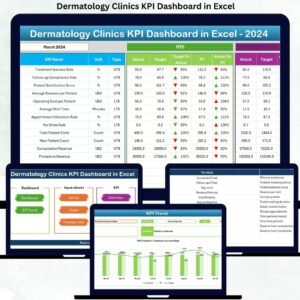
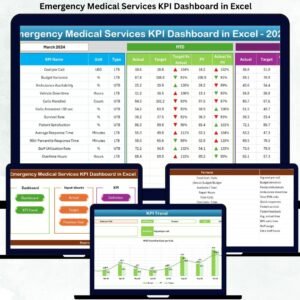
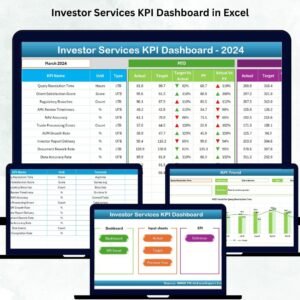
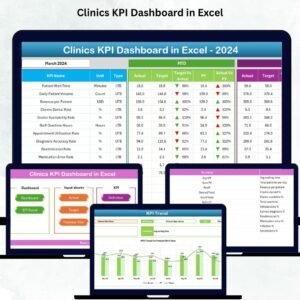
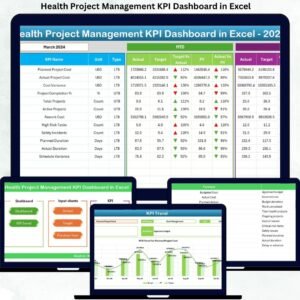
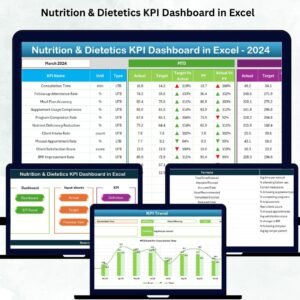
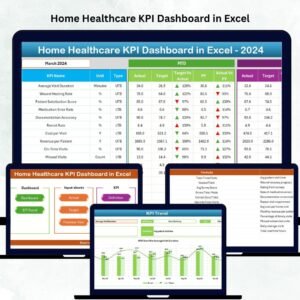
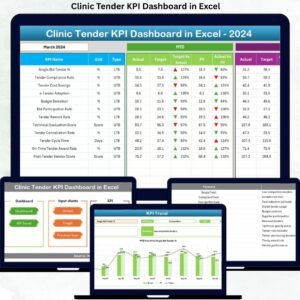
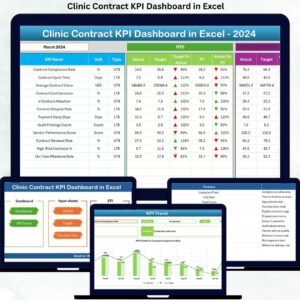
✅ Interactive Dashboard Sheet: Choose any month from a drop-down (Cell D3) and instantly see updated KPI results. Compare Actual vs Target, monitor Previous Year trends, and visualize growth using intuitive arrows and traffic-light icons.
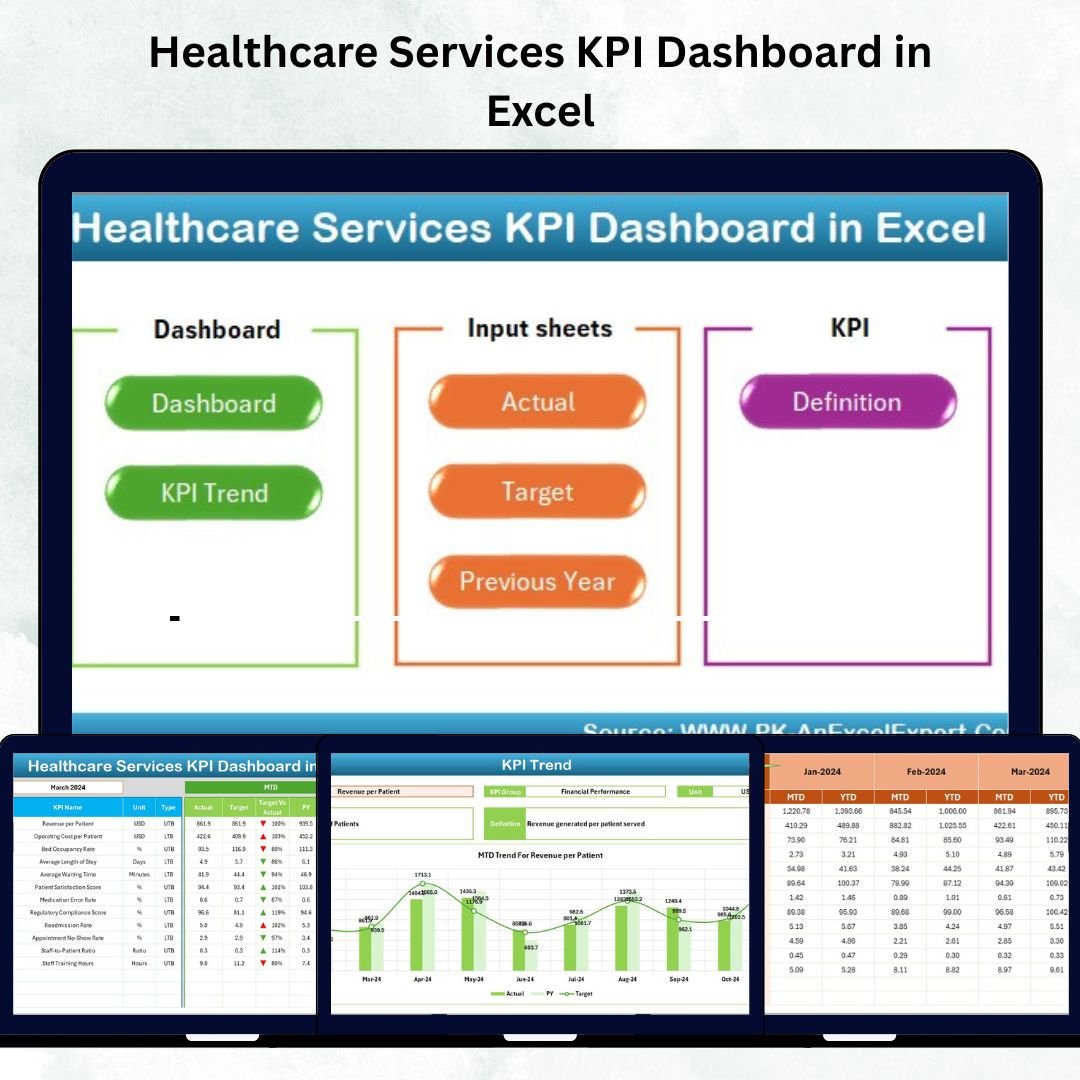
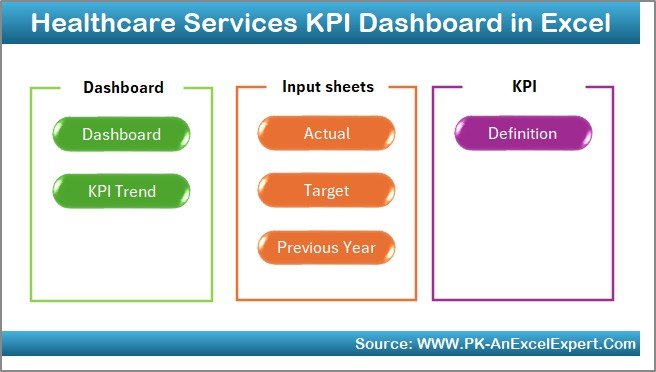
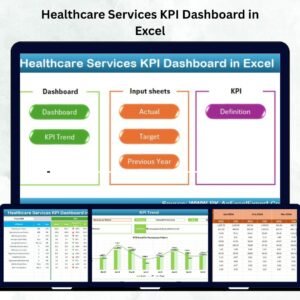
✅ 7 Smartly Designed Sheets: Includes Home, Dashboard, KPI Trend, Actual Numbers Input, Target, Previous Year, and KPI Definition sheets for seamless navigation and clarity.
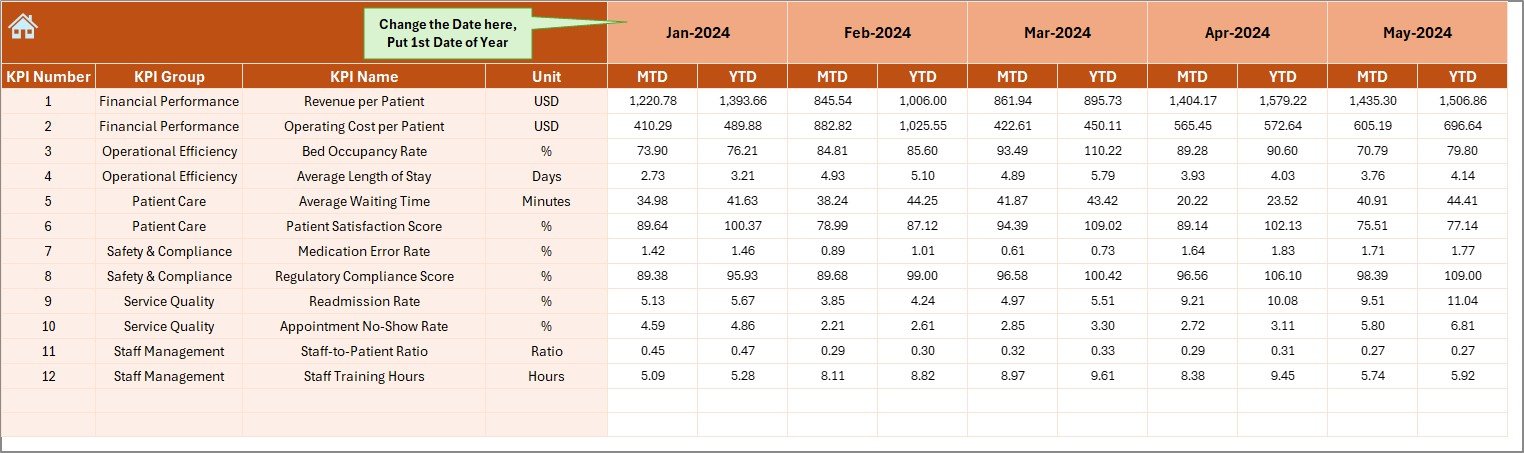
✅ Automated MTD & YTD Analysis: Get automatic updates across all KPIs — no need to manually calculate trends or totals.
✅ Conditional Formatting & Visual Indicators: Red, yellow, and green icons instantly show which KPIs are on track or need attention.
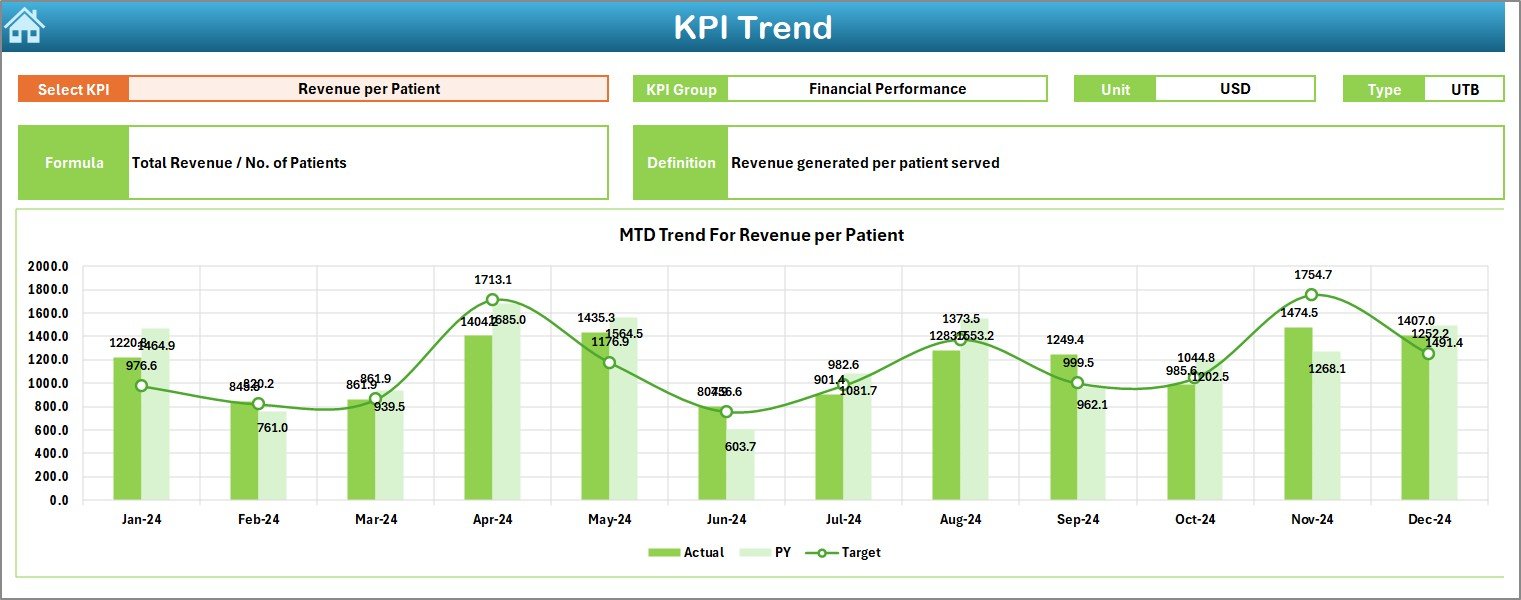
✅ Dynamic KPI Trend Charts: Visualize monthly performance using easy-to-read trend lines and charts.
✅ No Macros Required: 100% formula-based Excel file, ensuring safety and compatibility on any system.
✅ Customizable KPIs: Modify KPI names, formulas, and units to match your specific healthcare environment.
✅ User-Friendly Navigation: Jump between sheets using pre-built buttons from the Home Page — simple, clean, and efficient.
📦 What’s Inside the Healthcare Services KPI Dashboard
📊 Dashboard Sheet – The core performance view with all healthcare KPIs in one place.
📈 KPI Trend Sheet – Select any KPI (Cell C3) to see historical MTD and YTD progress through interactive charts.
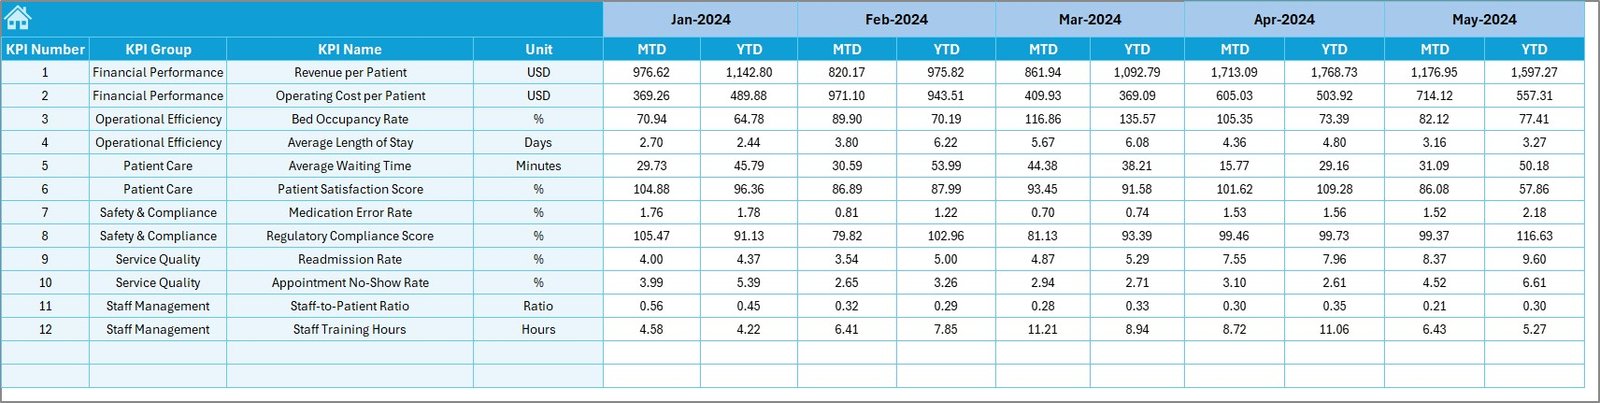
🧾 Actual Numbers Input Sheet – Record MTD and YTD values for each KPI and let the system auto-calculate summaries.
🎯 Target Sheet – Set monthly goals for KPIs and compare against actual results in real time.
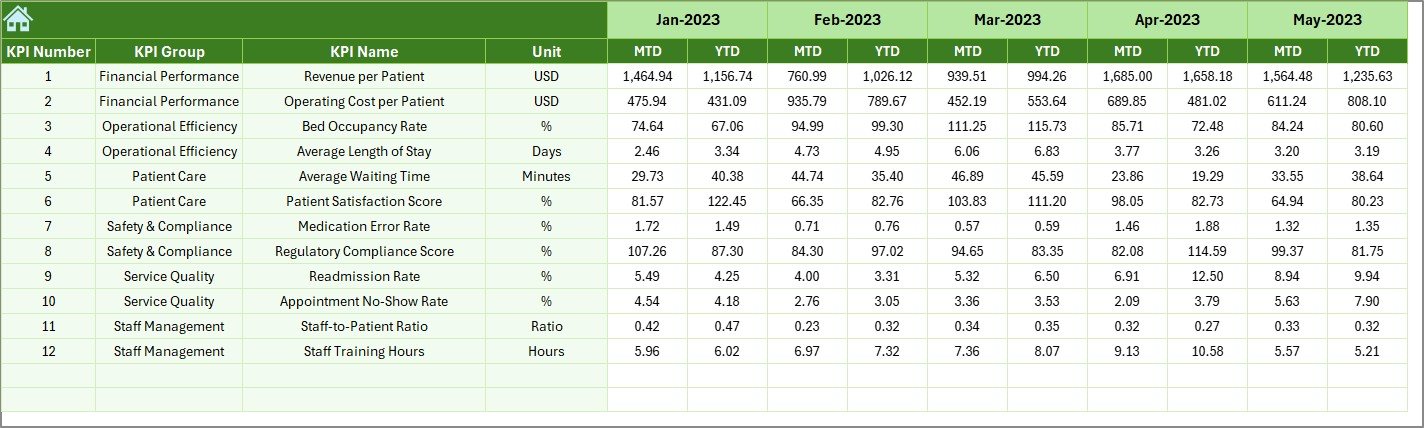
📅 Previous Year Sheet – Benchmark your performance against historical data.
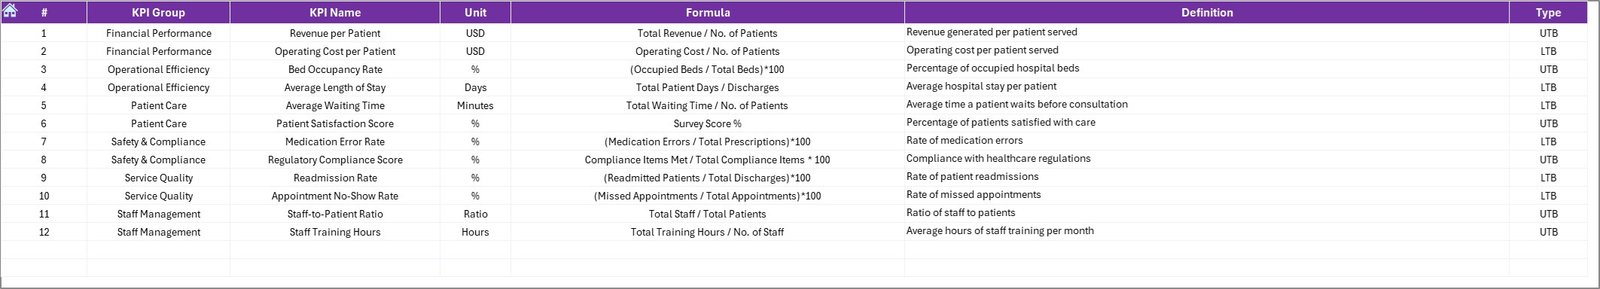
📚 KPI Definition Sheet – Your KPI dictionary with all key metrics, units, formulas, and definitions.
🏠 Home Sheet – A clean navigation hub to access all major sections quickly.Healthcare Services KPI Dashboard in Excel
Each sheet is linked intelligently, ensuring a fully automated and error-free experience for healthcare analysts and managers.
⚙️ How to Use the Healthcare Services KPI Dashboard
1️⃣ Open the Home Sheet – Use buttons to navigate easily.
2️⃣ Set Targets: Go to the Target Sheet and enter your monthly/yearly KPIs.
3️⃣ Input Actual Data: Add MTD/YTD actuals in the Input Sheet.
4️⃣ Update Past Data: Enter last year’s performance in the Previous Year Sheet.
5️⃣ Select Month: Pick a month in Cell D3 of the Dashboard Sheet.
6️⃣ View Insights: All KPIs and visuals update instantly for that selected month.
7️⃣ Analyze Trends: Open the KPI Trend Sheet for visual progress tracking.
That’s it! The dashboard auto-calculates comparisons, applies color indicators, and generates professional reports — ready for team meetings or performance reviews.
👥 Who Can Benefit from This Healthcare Services KPI Dashboard
🏥 Hospital Administrators: Track efficiency, patient satisfaction, and department performance.
🧪 Diagnostic Centers: Analyze test turnaround time, cost per test, and accuracy rates.
👩⚕️ Clinic Managers: Monitor doctor utilization, patient flow, and appointment adherence.
💰 Finance Teams: Measure revenue per bed, cost variance, and budget utilization.
📋 Quality Assurance Officers: Ensure compliance and patient safety indicators are within standard limits.
📈 Healthcare Consultants: Present data-driven insights to clients with ready-made visuals.
🎯 Executives & Board Members: Get a top-level view of healthcare performance with clarity and precision.


Reviews
There are no reviews yet.