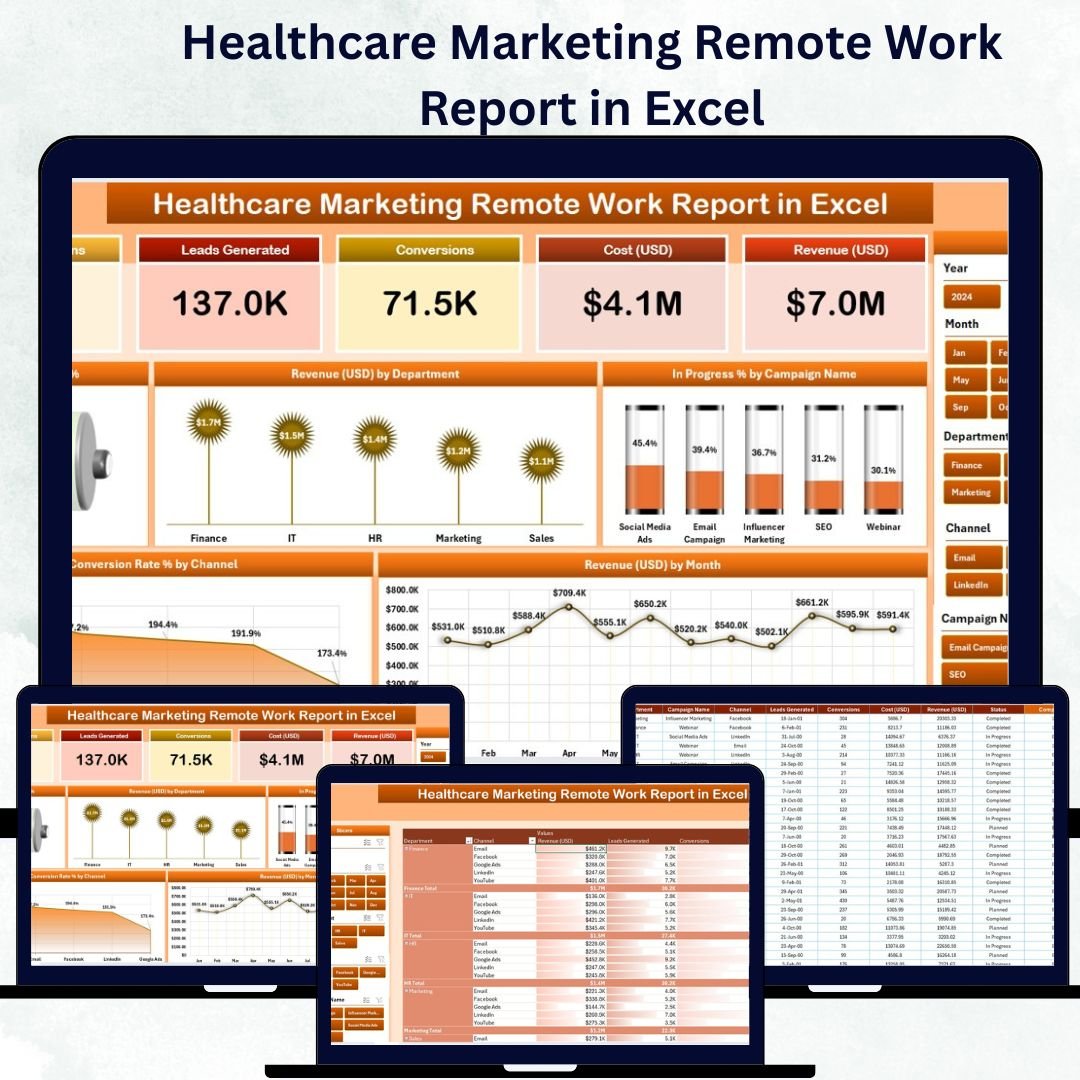
In today’s digital-first healthcare landscape, marketing teams operate across remote and hybrid environments — juggling campaigns, budgets, and conversions while staying compliant and efficient. The Healthcare Marketing Remote Work Report in Excel bridges that complexity by offering a centralized, interactive reporting solution built entirely in Microsoft Excel.
This ready-to-use Excel tool empowers healthcare marketers, analysts, and managers to track campaign progress, monitor conversion rates, and measure revenue — all from one structured dashboard. Whether your team works from hospital offices or remotely across regions, this report ensures data transparency, accountability, and alignment.
⚙️ Key Features of the Healthcare Marketing Remote Work Report in Excel
The template consists of three core pages and a support sheet, designed to streamline performance tracking and enable data-driven marketing management.
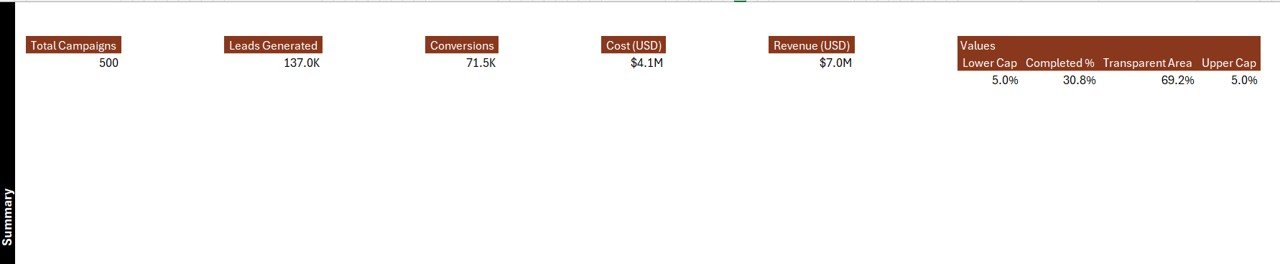
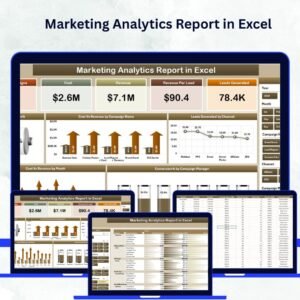
📊 1️⃣ Summary Page – The Central Dashboard
The Summary Page is your real-time command center for tracking performance and outcomes.
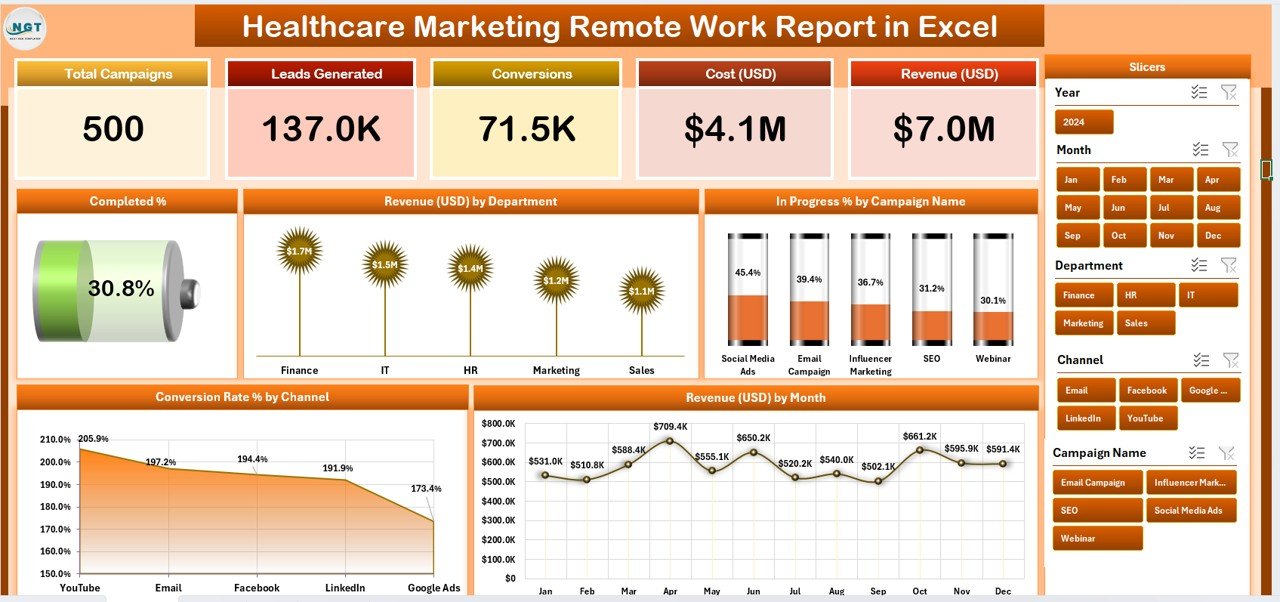
Top Highlights:
-
Five KPI Cards:
-
Total Campaigns
-
Completed %
-
In Progress %
-
Conversion Rate %
-
Total Revenue (USD)
-
-
Right-Side Slicer Panel: Filter data by department, campaign, or channel in seconds.
-
Dynamic Charts:
-
Completed %
-
Revenue (USD) by Department
-
In Progress % by Campaign Name
-
Conversion Rate % by Channel
-
Revenue (USD) by Month
-
These visuals bring clarity and depth to campaign analytics, enabling teams to identify bottlenecks, allocate budgets effectively, and enhance conversion performance.
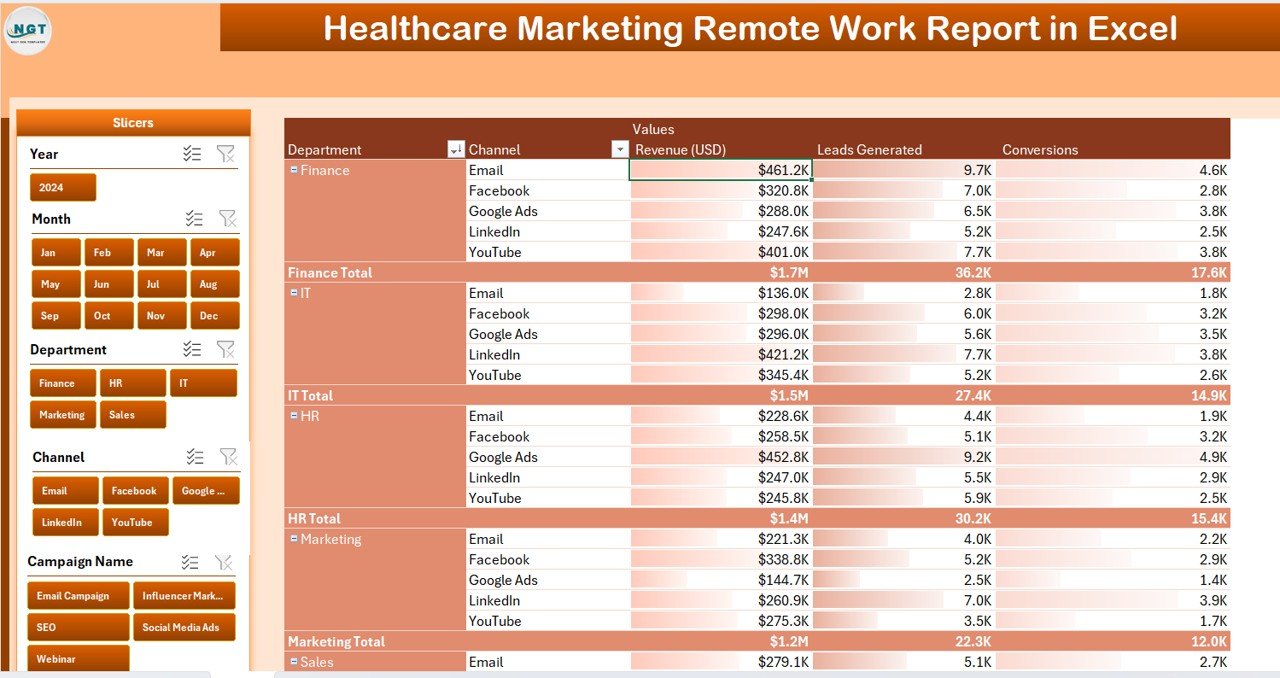
📋 2️⃣ Report Page – Campaign-Level Insights
For deeper analysis, the Report Page provides tabular details and filtering options.
Features Include:
-
Left-Side Slicers: Filter by campaign, department, channel, or responsible person.
-
Interactive Table: Displays campaign name, progress %, revenue, start and end dates, and remarks.
-
Real-Time Updates: As slicers change, the table automatically adjusts.
This view helps marketing analysts and team leads drill into specific campaigns to evaluate performance and ROI.
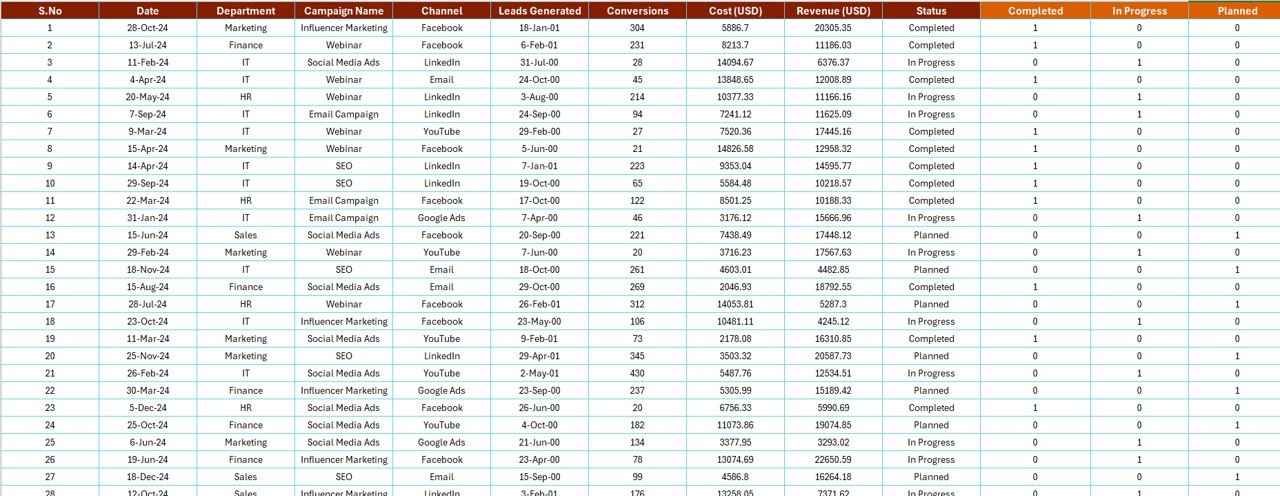
💾 3️⃣ Data Sheet – The Data Backbone
This sheet stores all raw campaign information that powers the visuals and KPIs.
Common Columns:
-
Campaign Name
-
Department
-
Responsible Person
-
Start Date / End Date
-
Channel
-
Conversion Rate %
-
Revenue (USD)
-
Status (Completed / In Progress / Not Started)
The dashboard automatically refreshes once new data is added — no manual recalculation needed.
🧩 Support Sheet – Data Consistency & Validation
The Support Sheet holds dropdown values and reference lists such as departments, campaigns, and channels. This ensures data uniformity and prevents input errors.
🩺 Why Healthcare Marketing Teams Need This Report
Remote work has transformed healthcare marketing — enabling flexibility but complicating performance tracking. This Excel report solves that problem by offering one synchronized system that helps you:
-
Monitor campaign completion and team progress.
-
Track revenue by department and channel.
-
Compare conversion rates across campaigns.
-
Identify the best-performing marketing strategies.
-
Manage remote teams with transparency and accountability.
🌟 Advantages of the Healthcare Marketing Remote Work Report in Excel
✅ Centralized Visibility – Keep all KPIs, campaigns, and results in one file.
✅ Improved Collaboration – Shared access through OneDrive or SharePoint keeps everyone aligned.
✅ Real-Time Insights – Pivot tables and slicers display live updates instantly.
✅ Customizable Design – Modify charts, colors, and KPIs to fit your brand.
✅ Cost-Effective – Delivers powerful analytics with no extra software costs.
✅ Easy to Use – Designed for marketers, not data scientists — no coding needed.
💡 How to Use the Report
1️⃣ Input Data: Enter campaign details into the Data Sheet.
2️⃣ Refresh Dashboard: Update pivot tables to reflect new entries.
3️⃣ Filter with Slicers: Analyze data by campaign, channel, or department.
4️⃣ Review Charts: View trends in revenue, conversion, and progress.
5️⃣ Share Insights: Export visuals to PDF or PowerPoint for management presentations.
This simple workflow ensures your marketing team stays informed and agile.
📈 Use Cases
💻 Campaign Performance Review: Evaluate multiple campaigns across departments.
💰 Revenue Analysis: Compare total revenue by channel or department.
📊 Conversion Tracking: Identify which digital channels deliver the best ROI.
👥 Remote Team Monitoring: Track productivity and completion rates.
📆 Budget Optimization: Balance spend and returns for maximum impact.
🧠 Best Practices
✔️ Keep naming conventions consistent for departments and campaigns.
✔️ Refresh pivot tables after adding data.
✔️ Protect formulas and chart layouts to avoid accidental edits.
✔️ Use color coding (green/yellow/red) for quick status visualization.
✔️ Add optional automation (macros or Power Query) for advanced efficiency.
👥 Who Can Benefit
-
🧑💼 Marketing Managers: Evaluate campaign and budget performance.
-
💻 Remote Teams: Stay aligned through a single reporting framework.
-
🏥 Healthcare Organizations: Track marketing effectiveness across regions.
-
📈 Analysts: Derive insights from data without complex tools.
-
💬 Executives: View concise summaries and visual trends instantly.
🔗 Integration Opportunities
🔄 Connect with Power BI for advanced visualizations.
☁️ Store on SharePoint or OneDrive for multi-user collaboration.
📊 Use Power Query to import CRM or Google Analytics data automatically.
💬 Conclusion
The Healthcare Marketing Remote Work Report in Excel is more than a spreadsheet — it’s a unified analytics solution for modern healthcare marketing teams. It ensures transparency, boosts accountability, and delivers actionable insights — even in remote or hybrid setups.
With this dashboard, marketers can track campaign success, measure conversion rates, and monitor revenue performance in real time — all within Excel. It’s the ultimate blend of simplicity, flexibility, and analytical power designed to help healthcare teams thrive in the digital era.
🔗 Click here to read the Detailed Blog Post
🎥 Visit our YouTube channel for tutorials
🔗 YouTube.com/@PKAnExcelExpert


Reviews
There are no reviews yet.