Managing healthcare procurement without proper performance tracking often leads to cost overruns, delays, and compliance risks. That is why modern healthcare organizations rely on data-driven dashboards to gain visibility, improve efficiency, and make informed decisions.
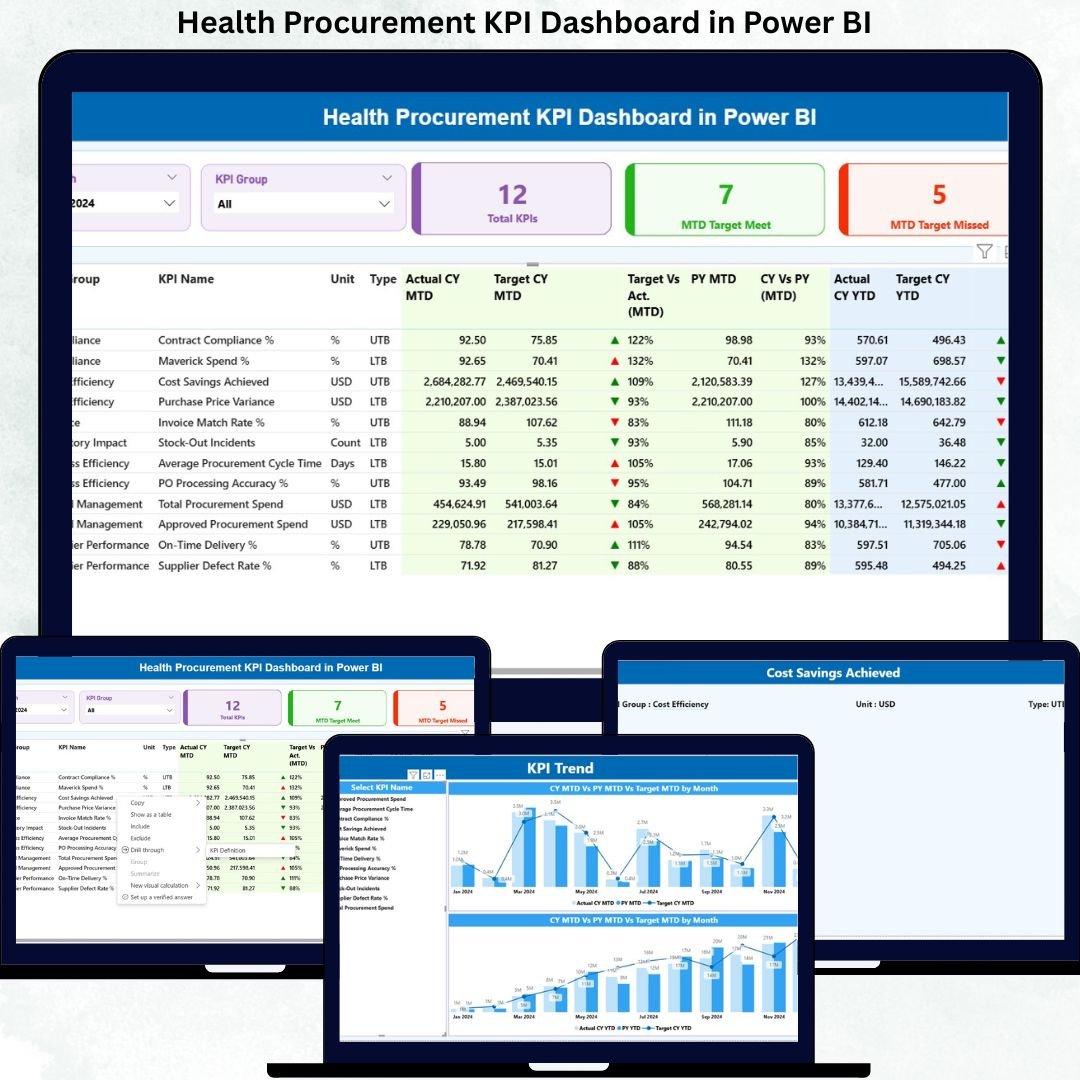
The Health Procurement KPI Dashboard in Power BI is a professionally designed, ready-to-use analytics solution that helps healthcare teams monitor procurement performance, track KPIs, analyze trends, and control spending — all from a single interactive dashboard.
This dashboard transforms complex procurement data into clear, actionable insights using Power BI and Excel. Whether you manage hospital procurement, vendor sourcing, or healthcare supply chains, this dashboard gives you complete control with accuracy and confidence.
✅ Key Features of Health Procurement KPI Dashboard
📊 Interactive Power BI Dashboard – Visually rich layout with dynamic charts and KPI indicators
📅 Month & KPI Group Slicers – Filter performance instantly by time period or KPI category
📈 MTD & YTD Performance Tracking – Monitor monthly and yearly procurement progress
🎯 Target vs Actual Analysis – Identify gaps and performance deviations instantly
🟢 Automated KPI Status Indicators – Green and red icons for quick performance review
📉 Trend Analysis Charts – Compare current year vs previous year performance
📂 Excel-Based Data Source – Easy to update without technical complexity
⚡ Fast & Accurate Reporting – Eliminates manual calculations and errors
📦 What’s Inside the Health Procurement KPI Dashboard
This Power BI dashboard consists of three powerful pages, each designed for deep procurement insights:
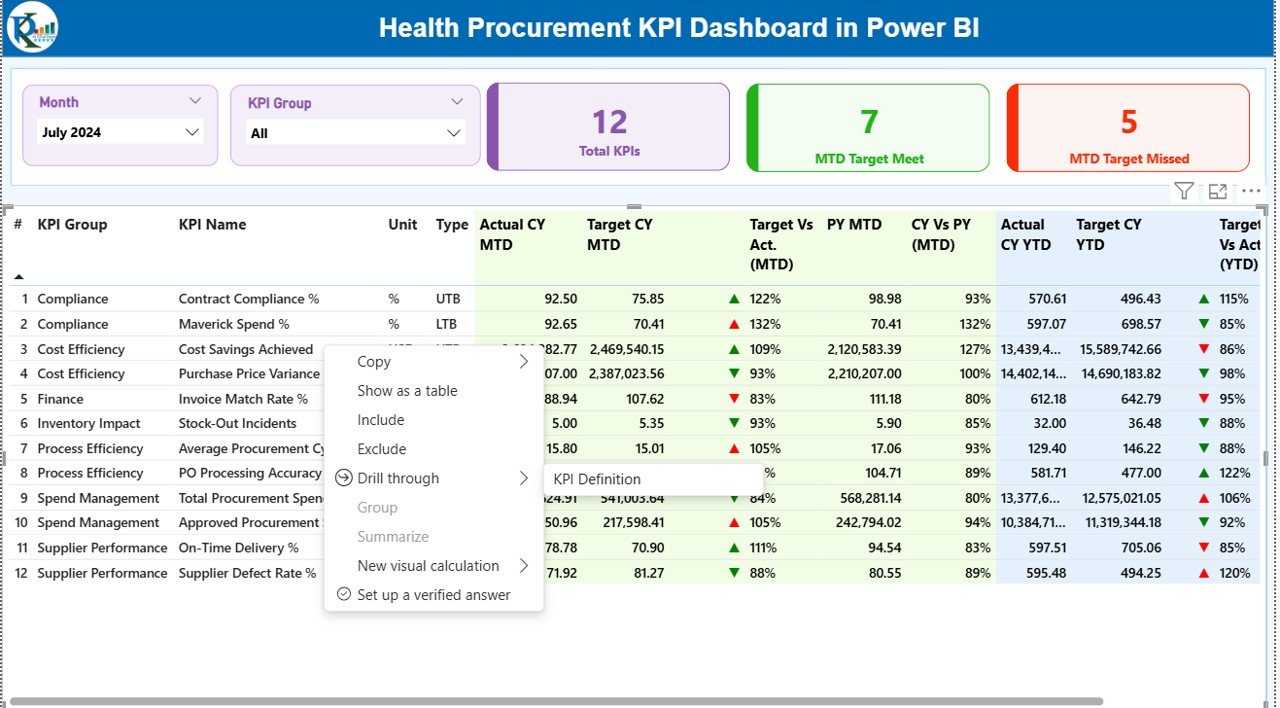
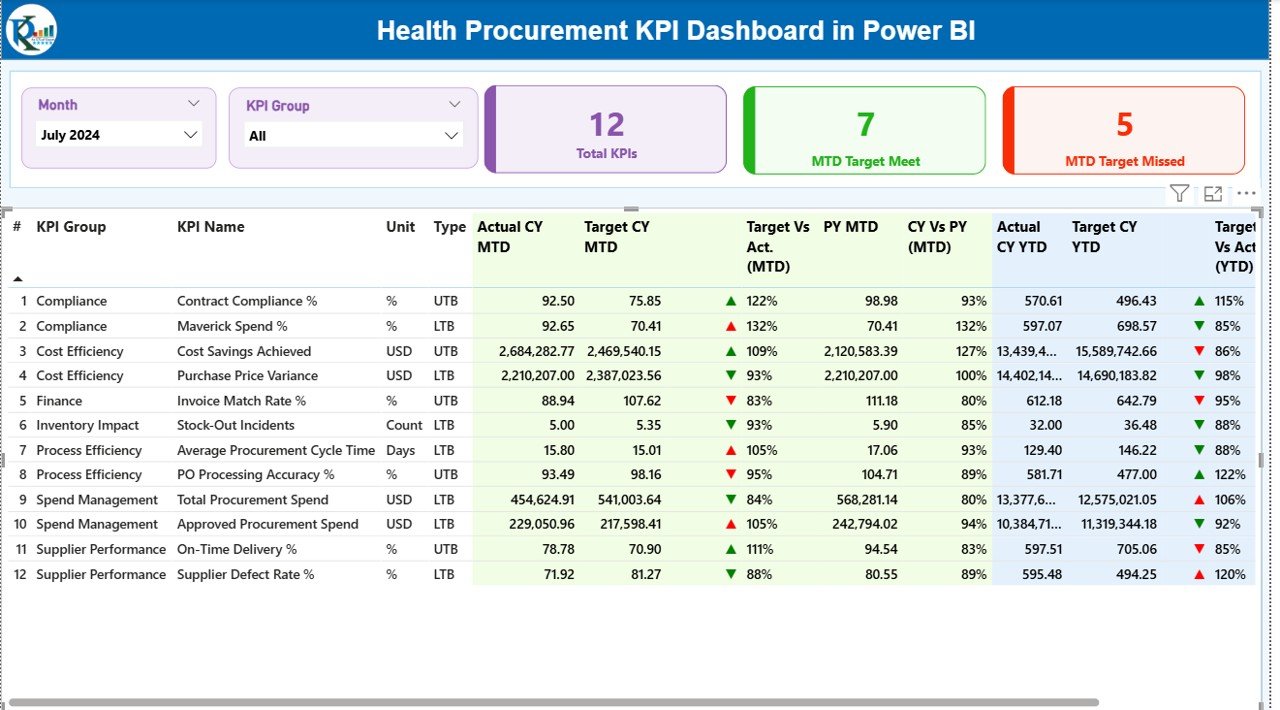
🔹 Summary Page
The central dashboard that provides an overview of procurement performance.
Includes:
-
Month & KPI Group slicers
-
Total KPI Count
-
MTD Target Met Count
-
MTD Target Missed Count
-
Detailed KPI table with:
-
KPI Number
-
KPI Group
-
KPI Name
-
Unit
-
KPI Type (LTB / UTB)
-
Actual vs Target (MTD & YTD)
-
Previous Year comparison
-
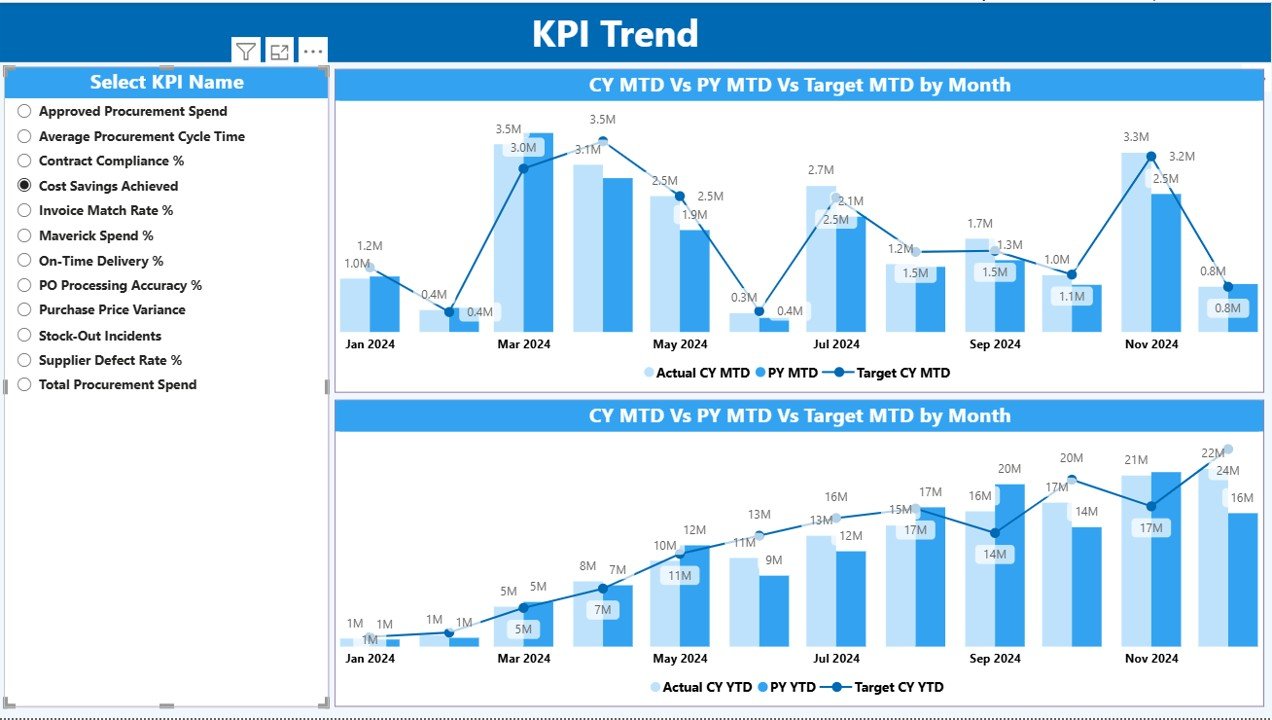
🔹 KPI Trend Page
This page focuses on visual trend analysis.
Includes:
-
Interactive combo charts
-
Current Year vs Previous Year comparison
-
MTD and YTD performance visualization
-
KPI selection slicer for deep analysis
Perfect for identifying trends, seasonality, and performance gaps.
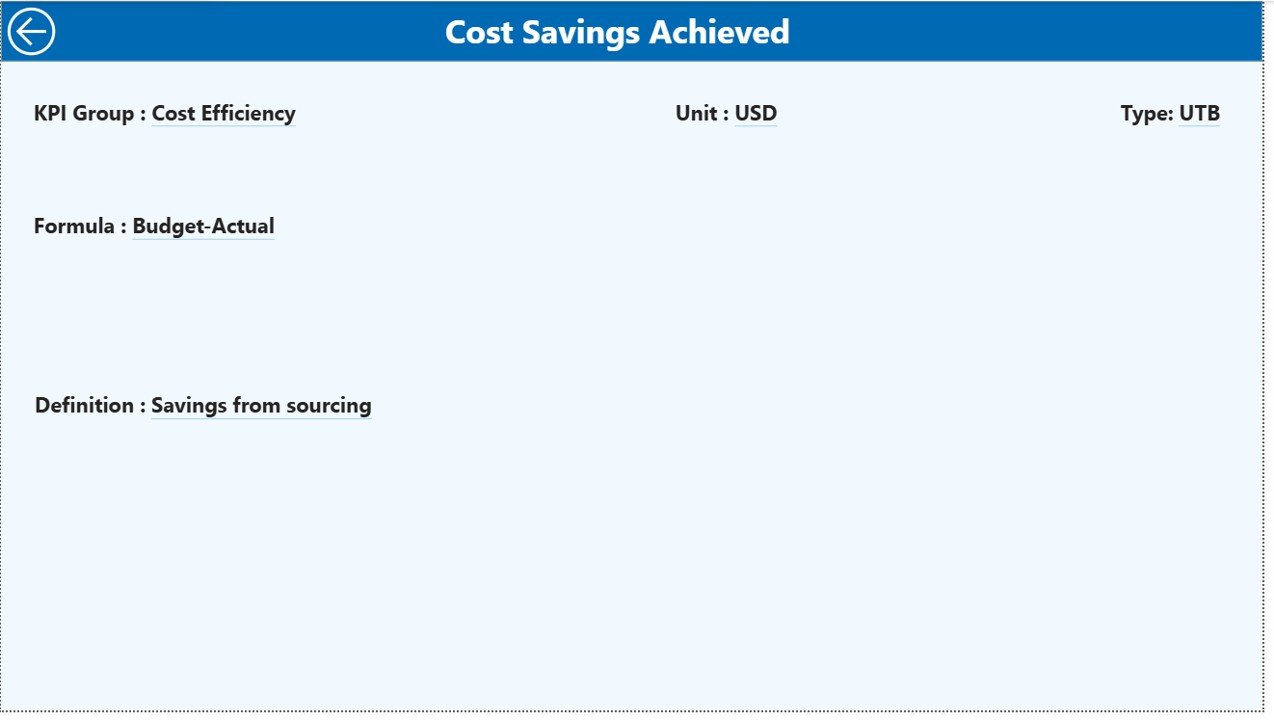
🔹 KPI Definition Page
A reference page that ensures complete clarity.
Displays:
-
KPI formula
-
KPI definition
-
Unit of measurement
-
KPI type (LTB / UTB)
This page helps users understand each KPI clearly and avoids misinterpretation.
⚙️ How to Use the Health Procurement KPI Dashboard
Using this dashboard is extremely simple:
1️⃣ Update procurement data in the Excel input files
2️⃣ Enter values for:
-
Actual MTD & YTD
-
Target MTD & YTD
-
KPI details
3️⃣ Refresh the Power BI file
4️⃣ Instantly view updated dashboards
5️⃣ Use slicers to analyze by month or KPI group
No advanced Power BI skills are required.
👥 Who Can Benefit from This Dashboard?
This dashboard is ideal for:
-
🏥 Healthcare Procurement Teams
-
📊 Hospital Administrators
-
💼 Finance & Accounts Teams
-
📦 Supply Chain Managers
-
📈 Healthcare Consultants
-
🧾 Compliance & Audit Teams
-
📉 Data Analysts
If you manage procurement performance, this dashboard will significantly improve visibility and control.
🚀 Why Choose This Dashboard?
✔ Saves time with automated reporting
✔ Improves procurement transparency
✔ Supports data-driven decisions
✔ Reduces manual work
✔ Easy to customize and scale
✔ Designed specifically for healthcare procurement
This dashboard helps organizations move from reactive reporting to proactive performance management.
Click here to read the detailed blog post
Watch the step-by-step video tutorial:


Reviews
There are no reviews yet.