
Running a grocery store successfully requires much more than stocking products and serving customers. Every decision—from pricing and promotions to inventory management and customer engagement—is powered by data. Without the right system to track this data, managers often rely on guesswork. That’s where the Grocery Store KPI Dashboard in Power BI comes in.
This prebuilt dashboard transforms raw numbers into actionable insights, helping grocery store owners, managers, and teams monitor performance in real time. With clear visuals, drill-through capabilities, and Excel integration, it becomes a complete decision-making tool.
✨ Key Features of Grocery Store KPI Dashboard in Power BI
-
📊 Comprehensive KPI Tracking – Sales, costs, stock levels, and customer engagement in one place.
-
🔍 MTD & YTD Insights – Monitor month-to-date and year-to-date performance.
-
⬆️⬇️ Target vs Actual Comparison – Green ▲ and red ▼ icons show progress instantly.
-
📈 Trend Analysis – Combo charts display performance vs targets and past years.
-
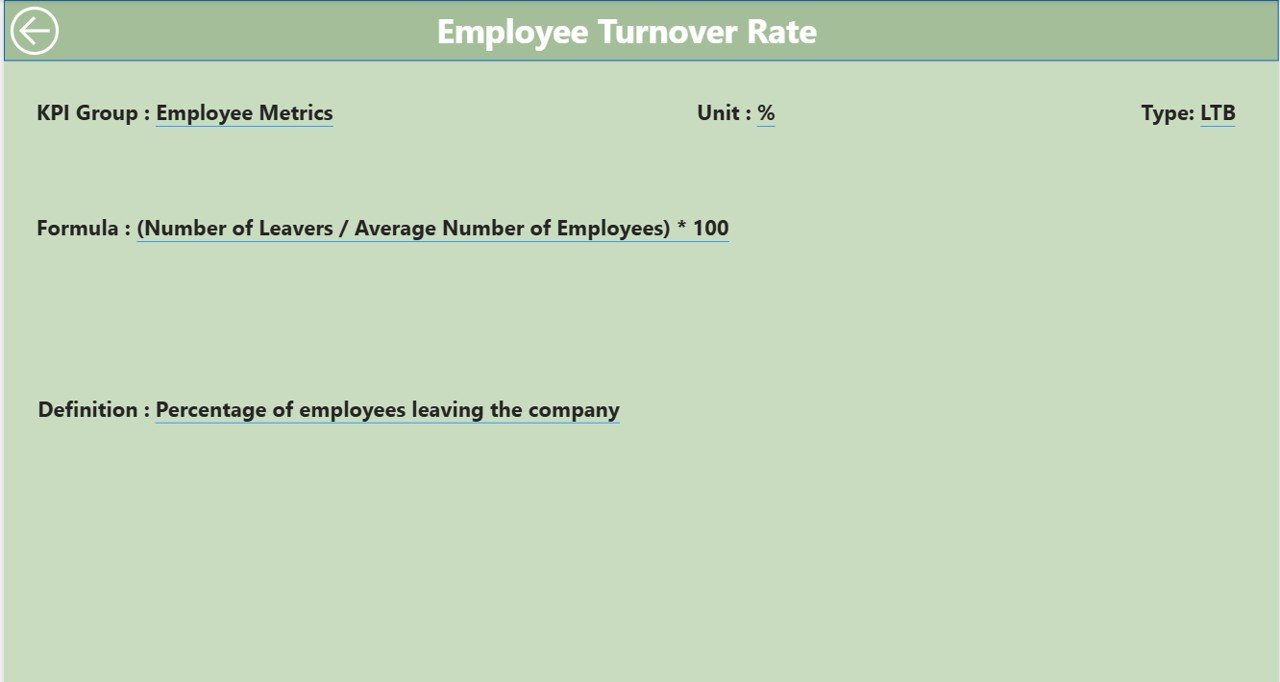
📑 Drill-Through Definitions – Understand each KPI’s formula, unit, and type (UTB/LTB).
-
📂 Excel Integration – Easily update data from structured Excel sheets.
-
🏪 Scalable Solution – Works for both single grocery stores and large retail chains.
📦 What’s Inside the Grocery Store KPI Dashboard
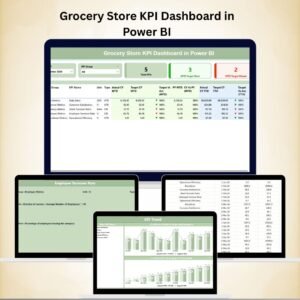
The dashboard is structured into three interactive pages:
-
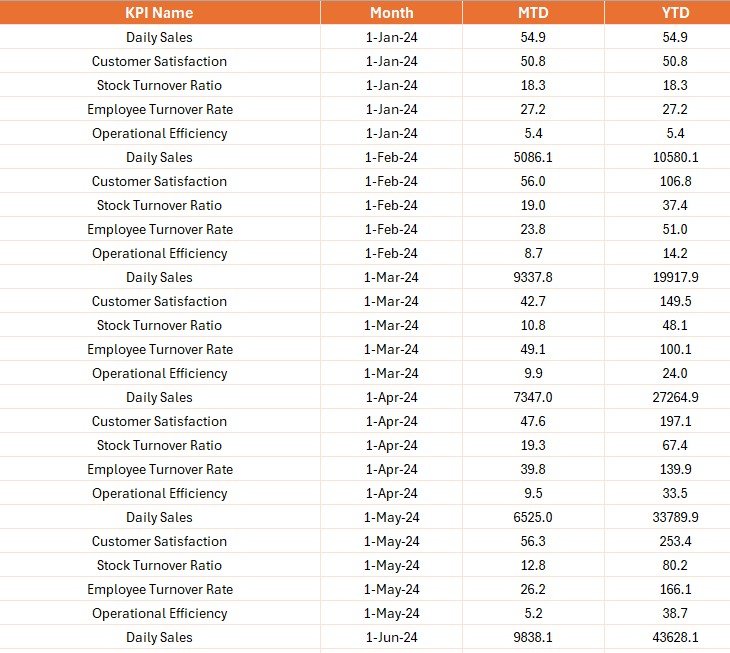
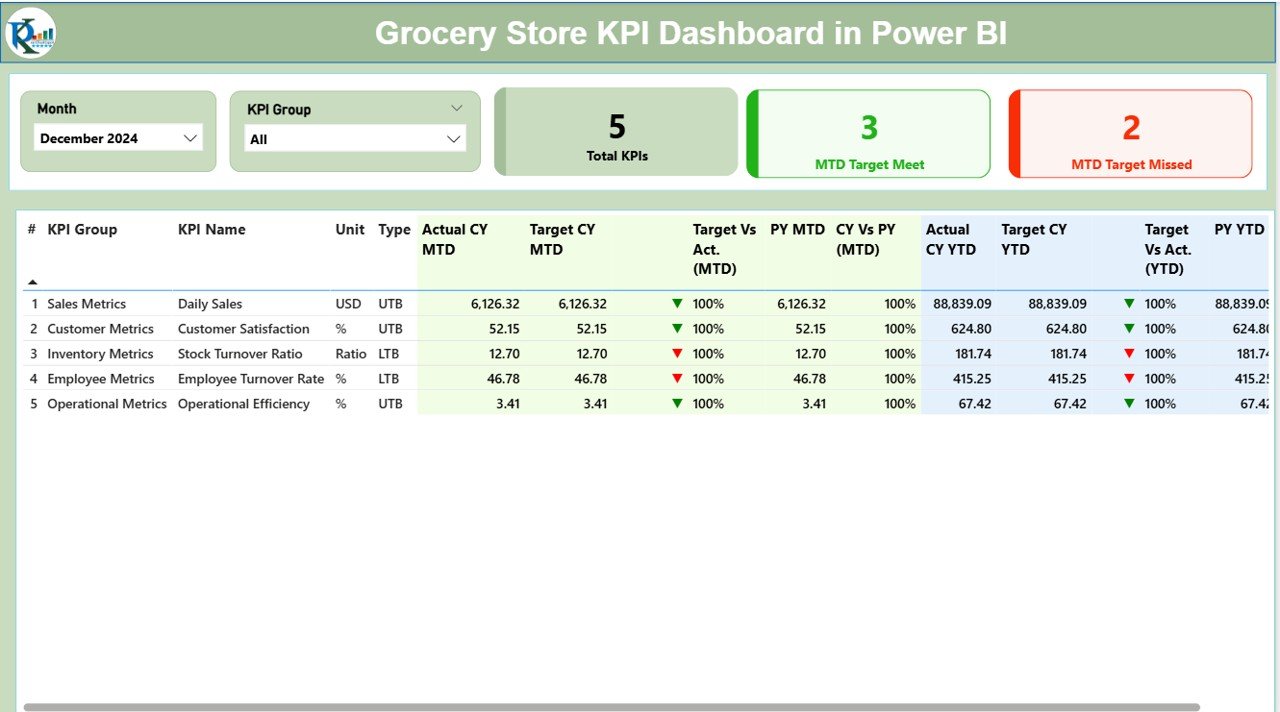
Summary Page – A snapshot of all KPIs with slicers for month and KPI groups. Includes KPI count, MTD/YTD status, and detailed KPI tables.
-
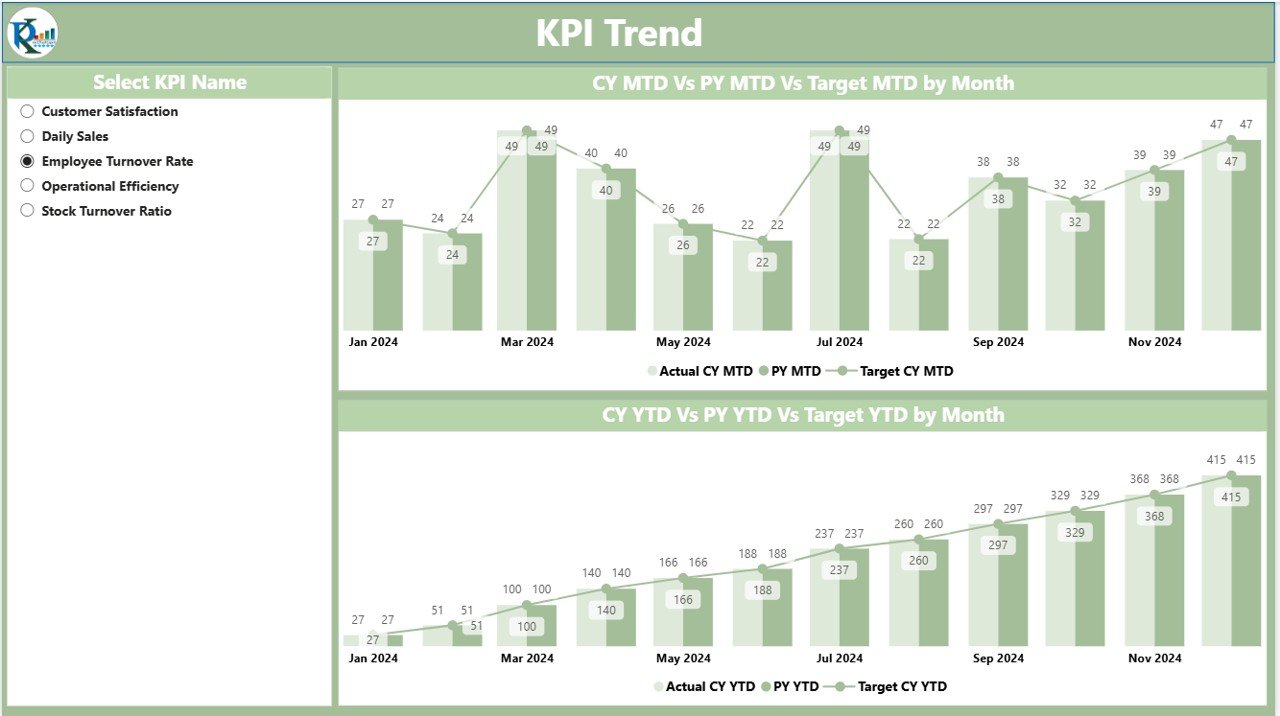
KPI Trend Page – Combo charts for visualizing Actual vs Target vs Previous Year values for both MTD and YTD. Includes slicer to focus on one KPI at a time.
-
KPI Definition Page – Hidden drill-through page that displays formula, unit, definition, and type for each KPI with easy navigation back.
Excel Data Source Structure
-
Input_Actual – Enter actual KPI values (MTD/YTD).
-
Input_Target – Enter target KPI values (MTD/YTD).
-
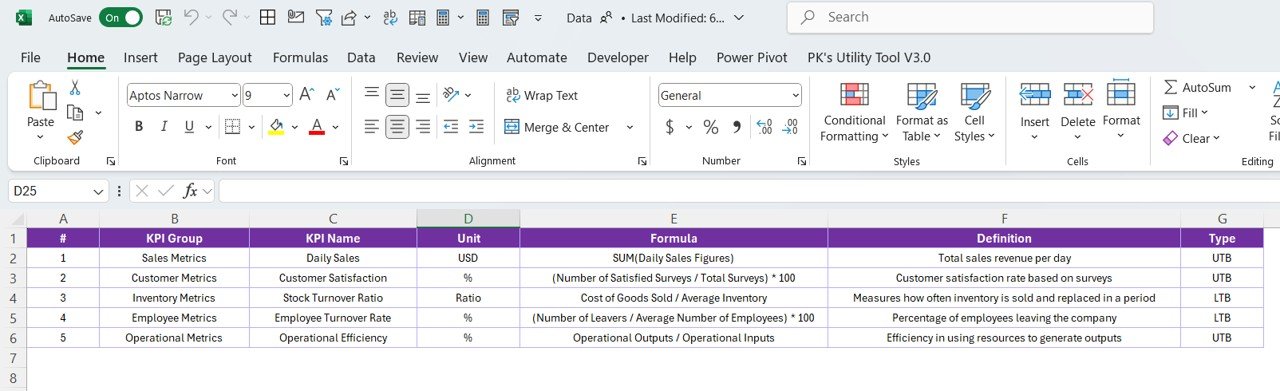
KPI Definition – Store KPI details like group, unit, formula, definition, and type.
This structure ensures quick updates and accurate reporting.
🛠️ How to Use the Grocery Store KPI Dashboard
-
Load the Excel source file with your actual and target data.
-
Use the slicers on the Summary Page to view KPIs by month or group.
-
Analyze KPI tables with MTD/YTD comparisons and trend icons.
-
Drill through to the KPI Definition Page for clarity on formulas and metrics.
-
Review KPI trends on the charts to spot patterns and opportunities.
-
Take action on insights—improve operations, reduce waste, and boost sales.
With minimal setup, your grocery business gains a powerful analytics engine.
👥 Who Can Benefit from This Dashboard
-
Grocery Store Owners – Track profitability, sales, and efficiency in real time.
-
Store Managers – Identify problem areas like inventory shrinkage or missed targets.
-
Finance Teams – Align costs and revenues with operational performance.
-
Operations Teams – Monitor stock turnover and reduce wastage.
-
Retail Chains – Standardize KPI tracking across multiple outlets.
📖 Click here to read the Detailed blog post
🎥 Visit our YouTube channel to learn step-by-step video tutorials


Reviews
There are no reviews yet.