Government agencies today operate under constant pressure to deliver services that are efficient, transparent, and accountable. Citizens expect timely updates, effective budget utilization, and improved service delivery, while administrators must ensure compliance, track performance, and optimize resources. Without a structured system, meeting these expectations becomes challenging.
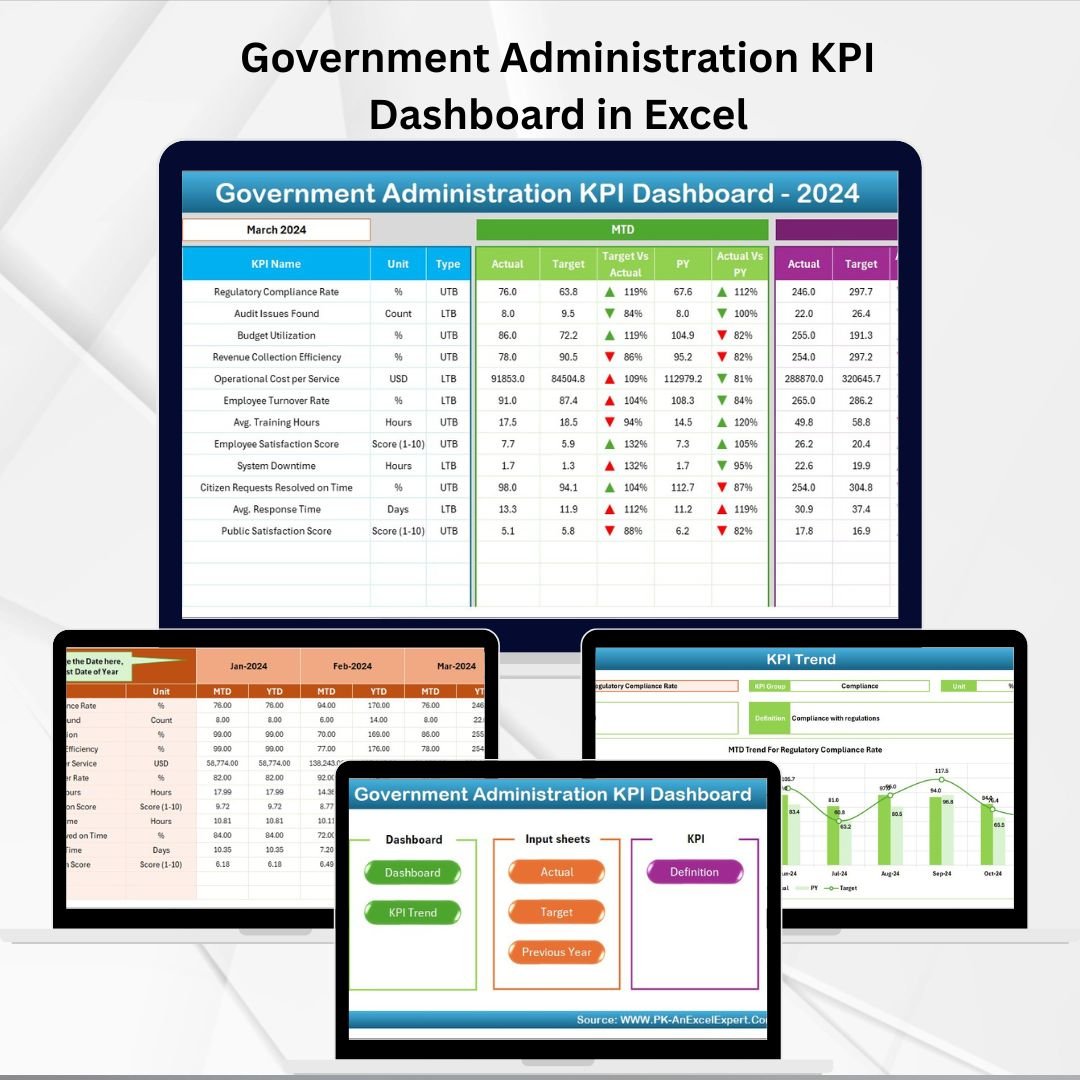
The Government Administration KPI Dashboard in Excel solves this problem by consolidating critical performance data into a single, interactive platform. Designed for municipal, state, and federal agencies, this dashboard empowers administrators to track progress, identify inefficiencies, and align services with citizen needs.
Built in Excel, the dashboard is both cost-effective and user-friendly, eliminating the need for expensive BI software. It provides structured navigation, real-time performance comparisons, and customizable KPIs—all in one place.
✨ Key Features of the Government Administration KPI Dashboard
-
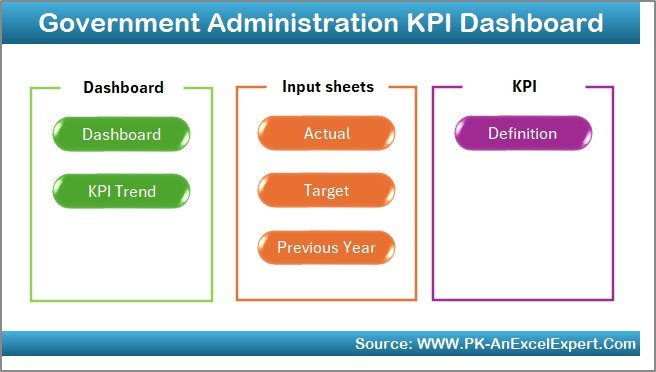
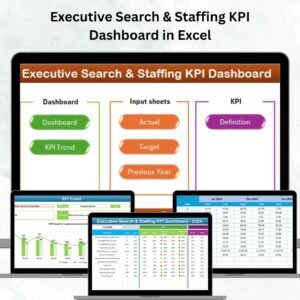
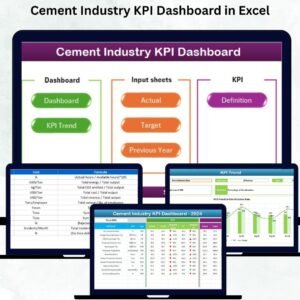
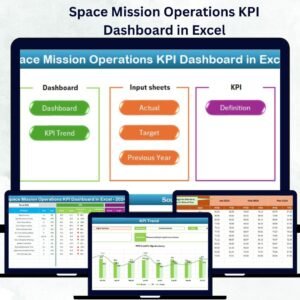
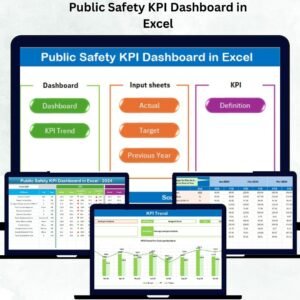
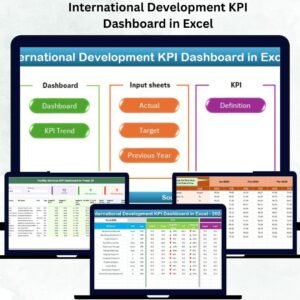
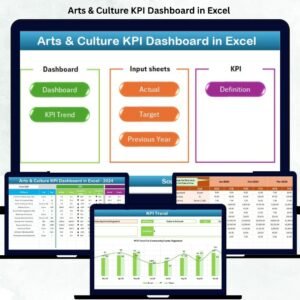
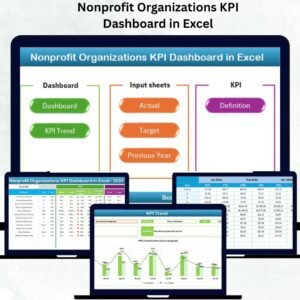
🏠 Home Sheet (Navigation Hub) – A central index with clickable buttons for quick access to all sections.
-
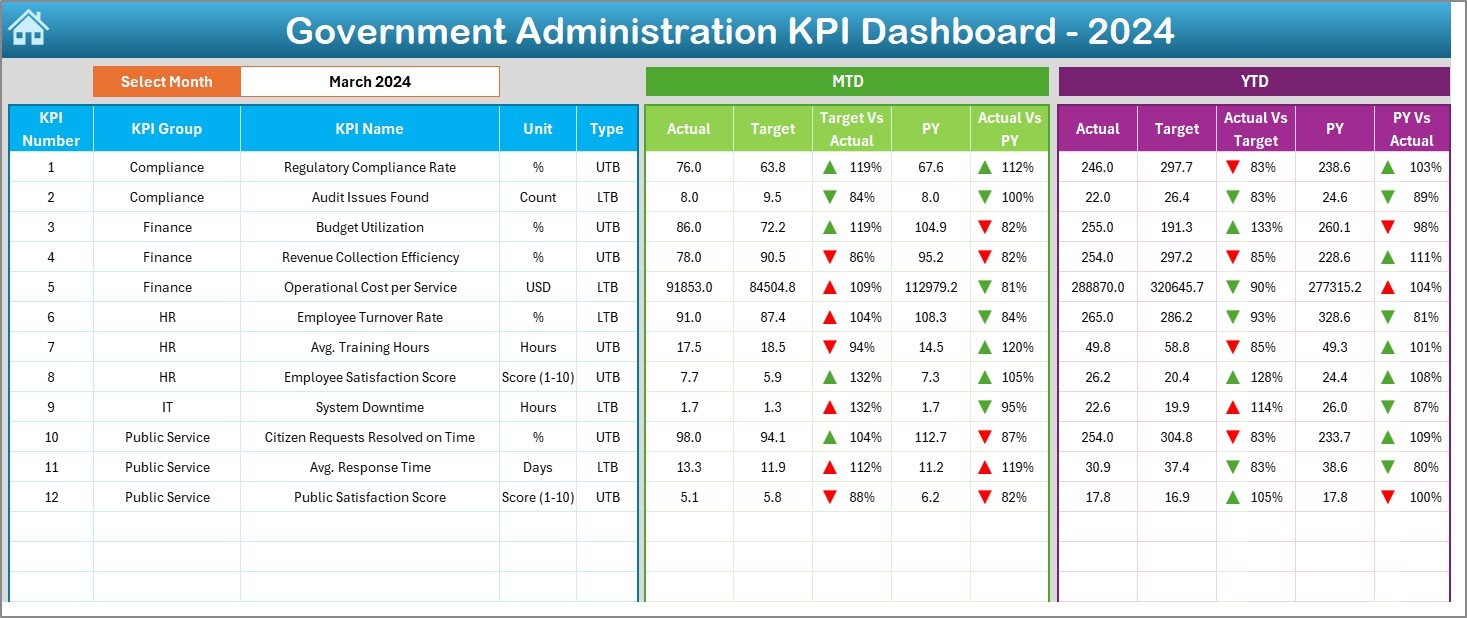
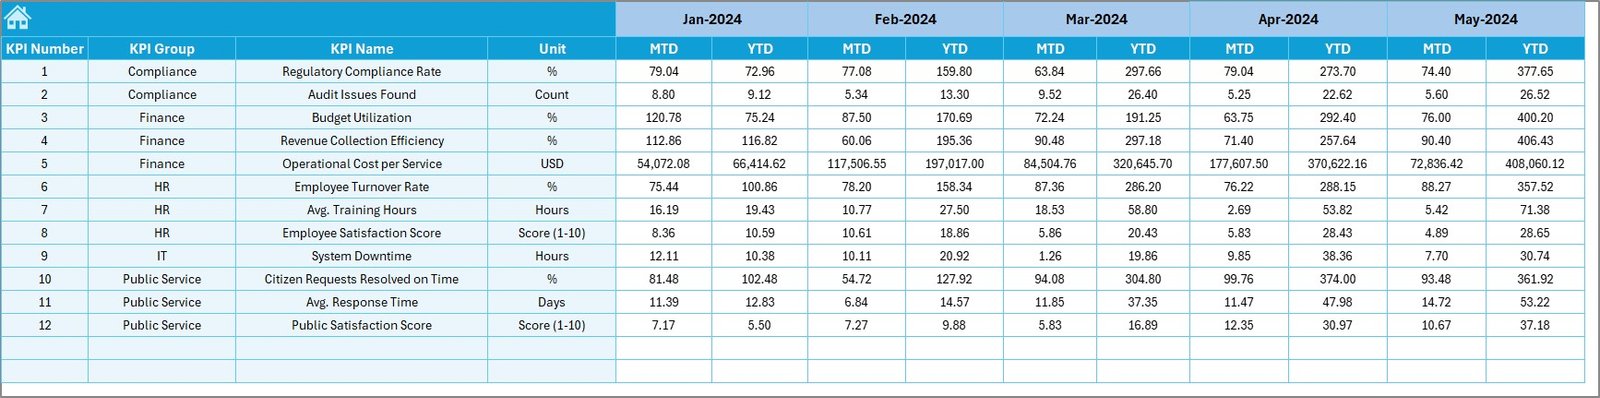
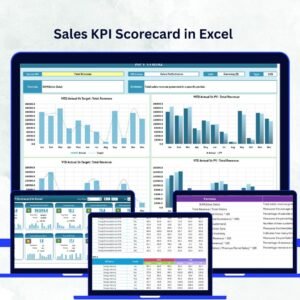
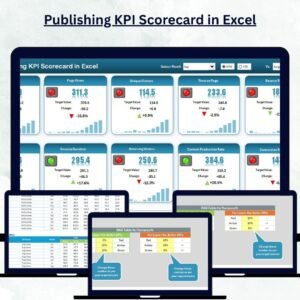
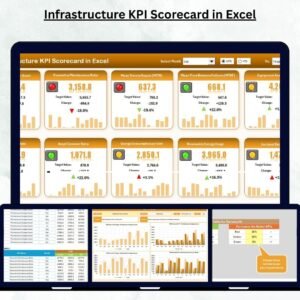
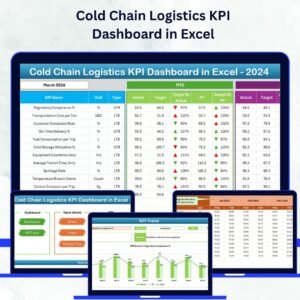
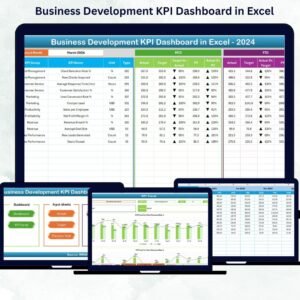
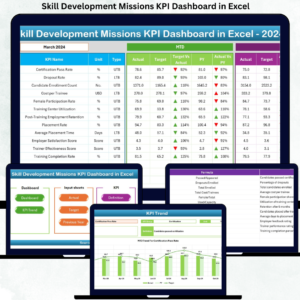
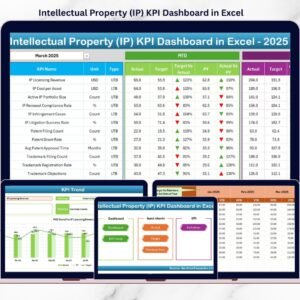
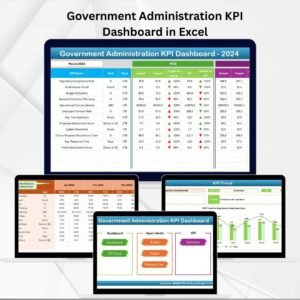
📊 Dashboard Sheet – The main control panel with Month-to-Date (MTD) and Year-to-Date (YTD) comparisons. Includes:
-
Actual, Target, and Previous Year data
-
Conditional arrows (▲/▼) to highlight performance trends
-
-
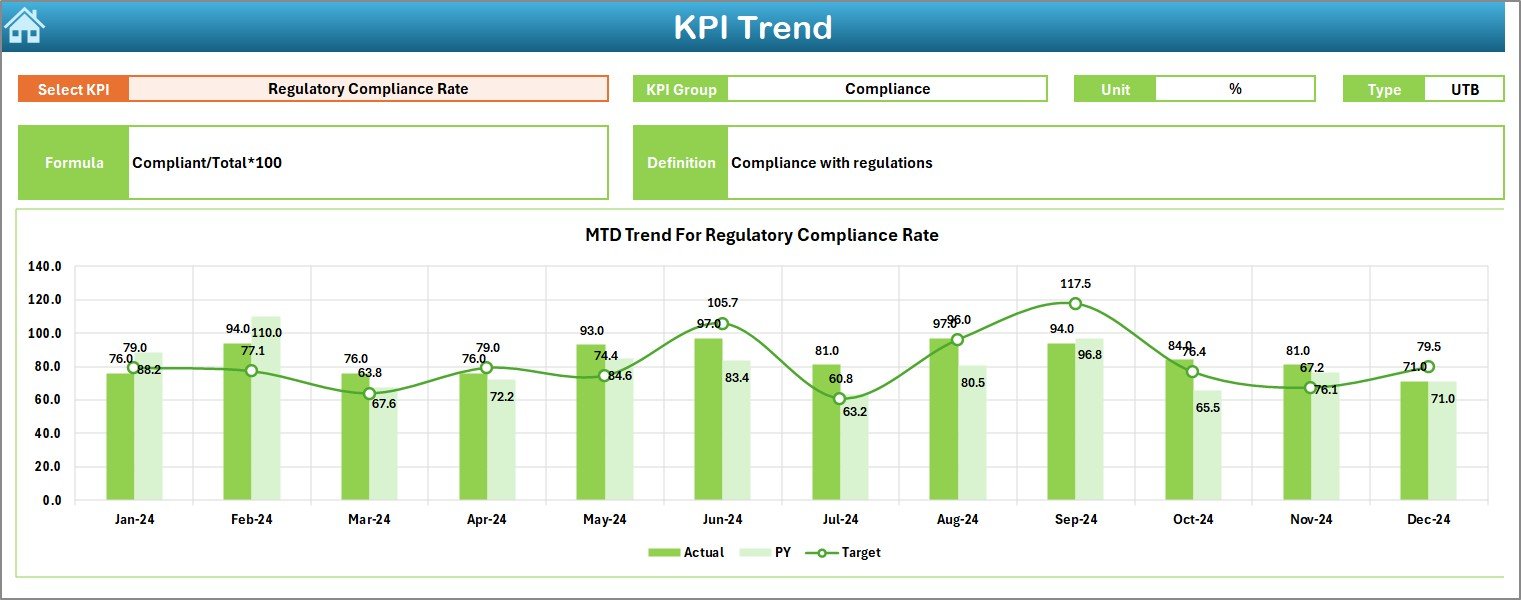
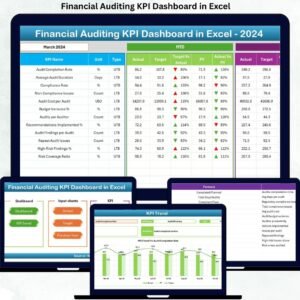
📈 KPI Trend Sheet – Select a KPI to view its details: group, unit, formula, and definition. Trend charts display MTD & YTD Actual vs Target vs Previous Year.
-
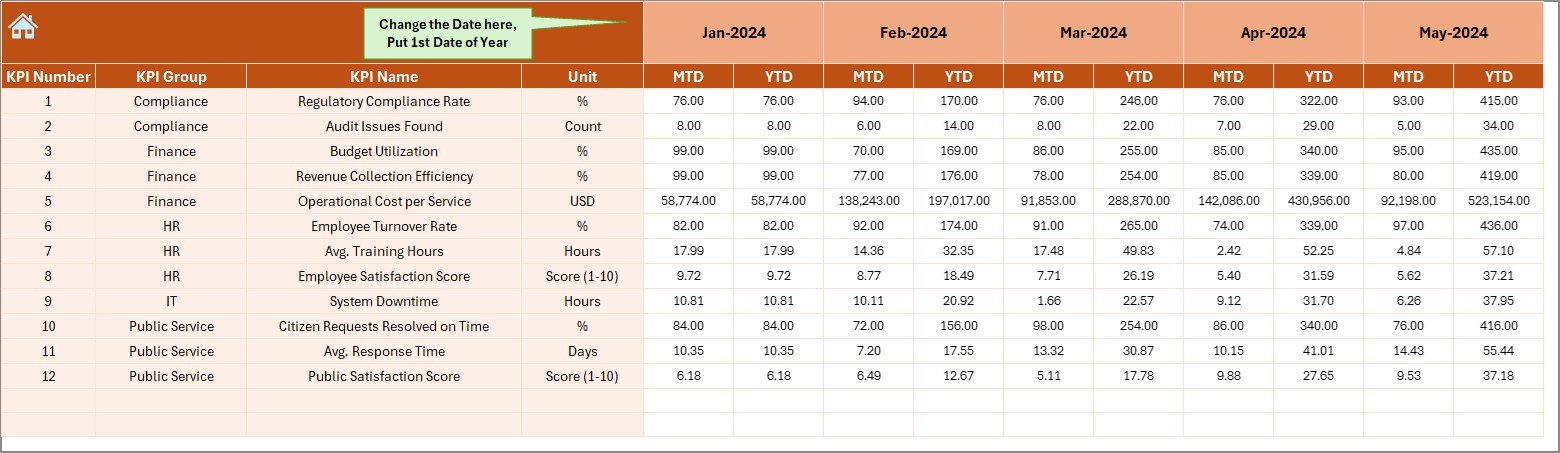
📝 Actual Numbers Input Sheet – Enter real data for each KPI. Automatically updates dashboard visuals.
-
🎯 Target Sheet – Define MTD & YTD benchmarks for goal tracking.
-
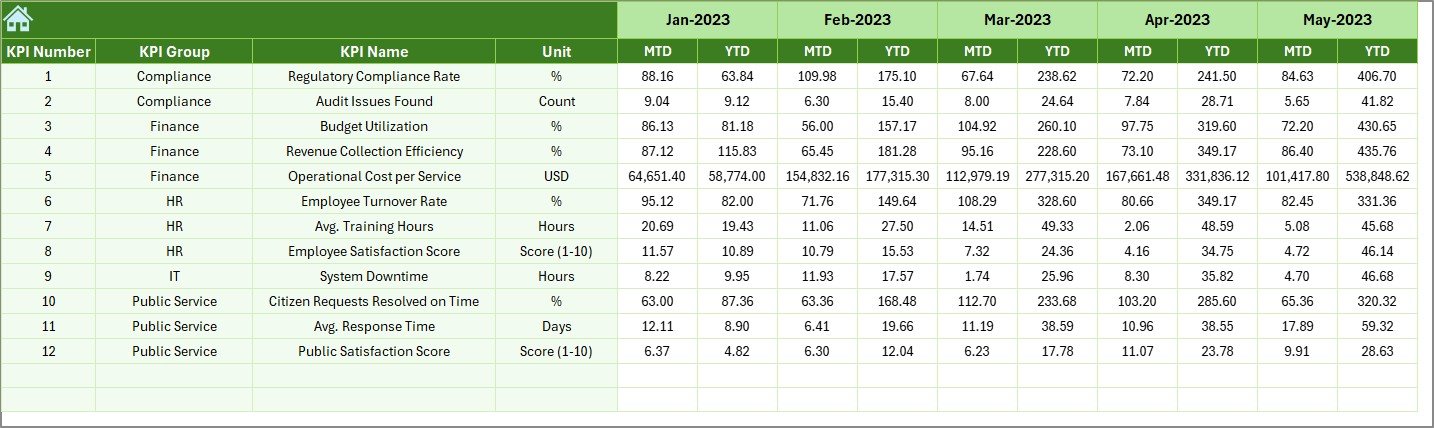
📂 Previous Year Number Sheet – Store historical data for year-on-year comparisons.
-
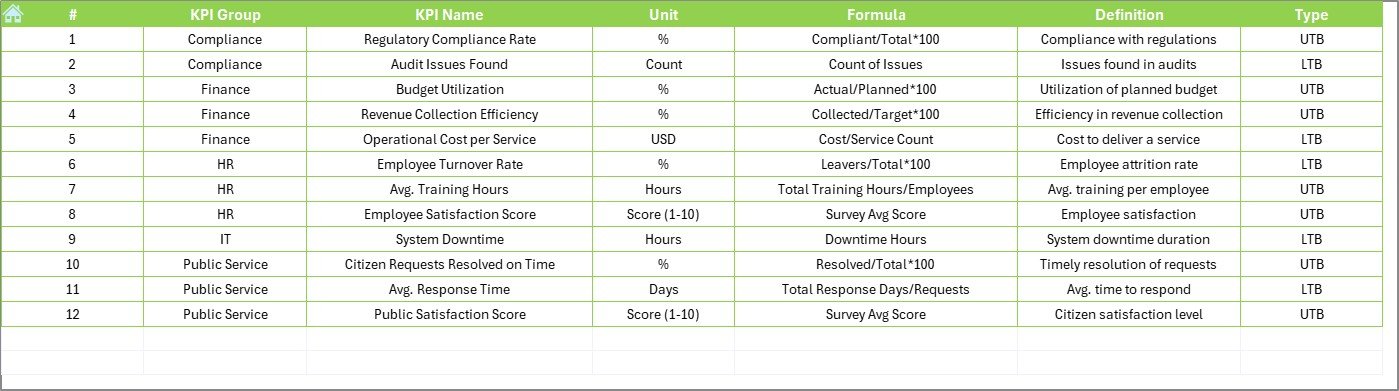
📑 KPI Definition Sheet – Acts as a KPI dictionary, ensuring consistency across departments.
📦 What’s Inside the Dashboard
When you download the Government Administration KPI Dashboard, you’ll receive:
-
A fully built Excel dashboard with 7 structured sheets.
-
Drop-down selectors for monthly data analysis.
-
Automated progress indicators to spot underperformance quickly.
-
A KPI library with formulas, definitions, and calculation types (UTB/LTB).
-
Templates for inputting actual, target, and previous year data.
🛠️ How to Use the Government Administration KPI Dashboard
-
Open the Home Sheet – Use buttons to navigate easily.
-
Enter Targets – Populate the Target Sheet with MTD & YTD goals.
-
Input Actuals – Add monthly figures in the Actual Numbers Input Sheet.
-
Add Historical Data – Record past-year performance for comparison.
-
Analyze Dashboard – Select a month in the Dashboard sheet to view results.
-
Drill Into Trends – Use the KPI Trend sheet to explore long-term performance.
-
Review & Refine – Regularly update inputs and refine KPIs as policies evolve.
👥 Who Can Benefit from This Dashboard?
-
🏛️ Municipal Administrators – Monitor waste collection, grievance redressal, and local projects.
-
🏥 State Governments – Track education, healthcare, and infrastructure performance.
-
🏢 Federal Agencies – Measure policy compliance and financial accountability.
-
💧 Public Utilities – Monitor electricity, water, or transport service efficiency.
-
📑 Policymakers & Auditors – Gain transparent insights for reporting and compliance.
🎯 Advantages of the Government Administration KPI Dashboard in Excel
-
📍 Transparency in Operations – Build citizen trust with clear reporting.
-
⚡ Data-Driven Decisions – Replace guesswork with actionable insights.
-
💰 Efficient Resource Allocation – Track budget utilization effectively.
-
🕒 Continuous Monitoring – Prevent last-minute compliance surprises.
-
📊 Performance Benchmarking – Compare with previous year trends.
-
💲 Cost-Effective – Works in Excel—no expensive licenses required.
🚀 Opportunities for Improvement
Agencies can enhance the dashboard by:
-
🔒 Adding password protection for sensitive data.
-
🤖 Using VBA automation for reminders and alerts.
-
🌐 Integrating with external databases for live data updates.
-
📱 Creating mobile-friendly versions for easy access.
-
📈 Scaling into Power BI for large datasets and advanced visuals.
🏆 Best Practices
-
Define 10–15 clear KPIs that reflect agency priorities.
-
Standardize data entry with drop-downs and validations.
-
Update actuals monthly to keep reporting accurate.
-
Use color coding (green/red) for quick visual insights.
-
Maintain previous year data for historical context.
-
Train staff to ensure consistent use across departments.
🌍 Real-World Use Cases
-
Municipal Corporations – Monitor cleanliness drives, utility management, and public services.
-
State Governments – Evaluate performance of healthcare, education, and welfare programs.
-
National Agencies – Track financial compliance, policy implementation, and citizen services.
-
Public Utilities – Ensure timely delivery of electricity, water, and transport.
📖 Click here to read the Detailed blog post
🎥 Visit our YouTube channel for step-by-step tutorials


Reviews
There are no reviews yet.