Managing government programs, departments, public services, and budgets is never simple. Every year, government organizations handle hundreds of projects across multiple regions while ensuring transparency, efficiency, and citizen satisfaction. However, when data is stored across disconnected spreadsheets and reports, decision-making becomes slow and complicated.
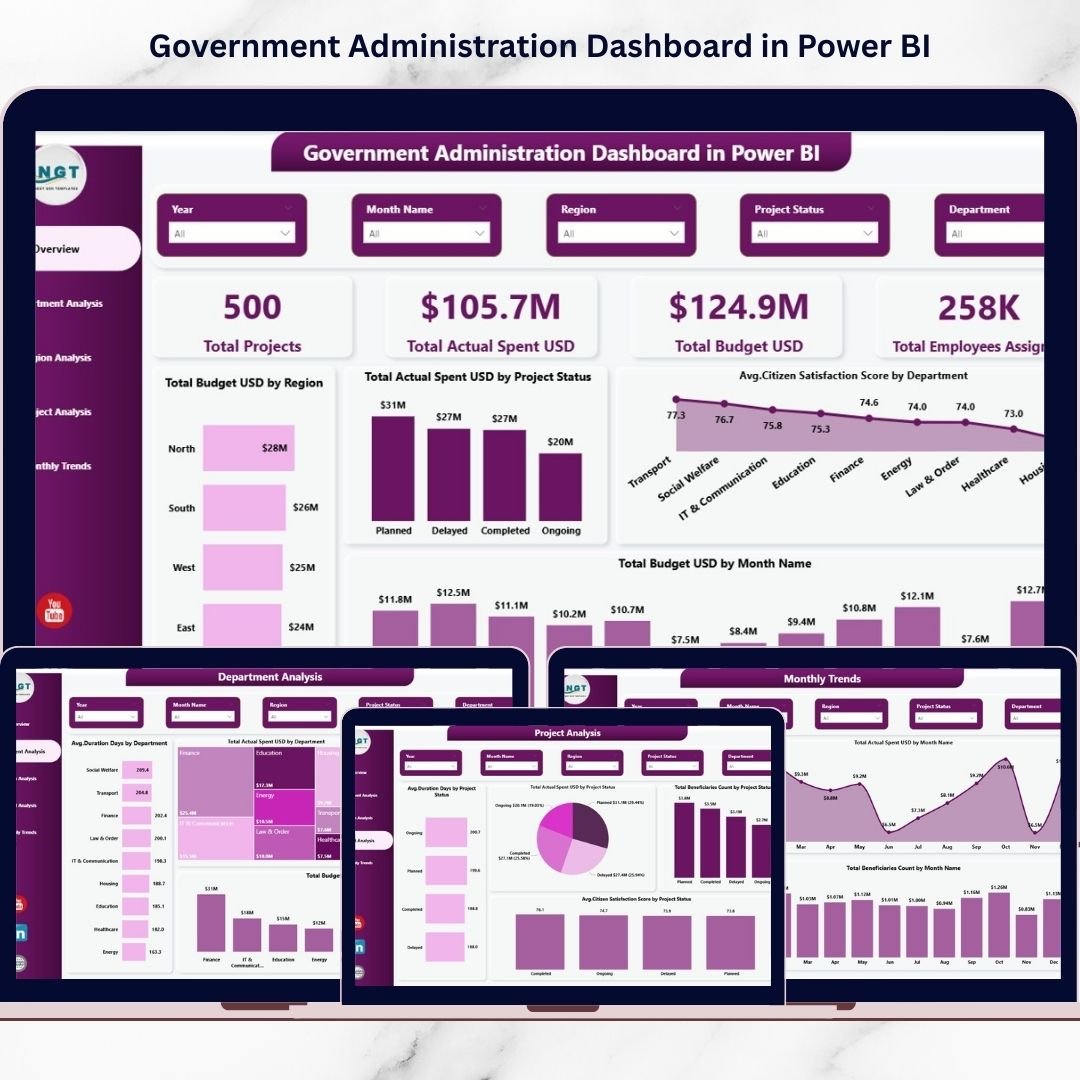
The Government Administration Dashboard in Power BI is designed to solve this challenge by transforming complex administrative data into clear, interactive, and actionable insights. Instead of manually reviewing reports, administrators and policymakers can monitor performance, spending, and service outcomes from a single centralized dashboard.
This ready-to-use Power BI solution helps government institutions analyze operations visually, improve accountability, and make faster policy decisions using real-time analytics. Whether tracking project progress, monitoring departmental efficiency, or evaluating citizen satisfaction, this dashboard provides everything leaders need to manage governance effectively.
Built using modern Power BI visualization capabilities, the dashboard enables users to filter data instantly, identify trends, and uncover performance gaps without technical complexity.
## 🚀 Key Feature of Government Administration Dashboard in Power BI
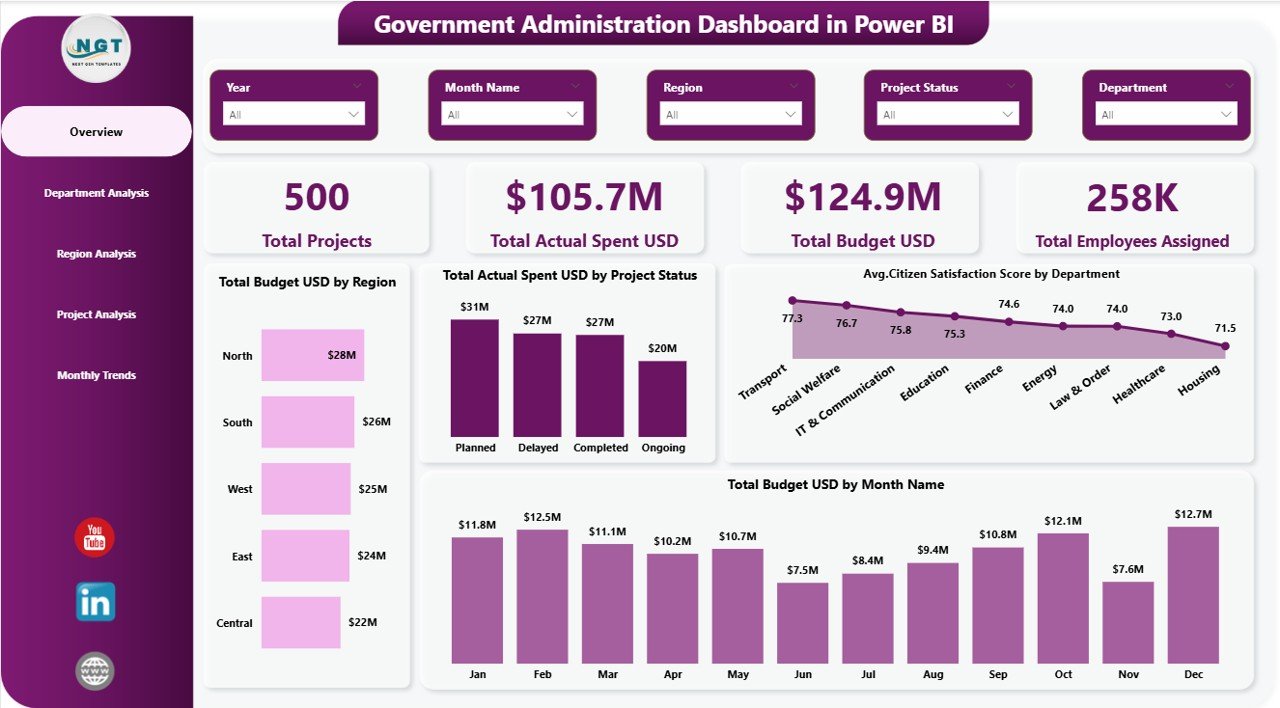
✅ Interactive KPI cards displaying total projects, budgets, spending, and workforce allocation
✅ Centralized administrative monitoring across departments and regions
✅ Budget vs. actual spending comparison for financial transparency
✅ Citizen satisfaction analysis for service quality measurement
✅ Department-wise performance tracking for operational efficiency
✅ Regional analytics to identify development gaps
✅ Project status monitoring to improve accountability
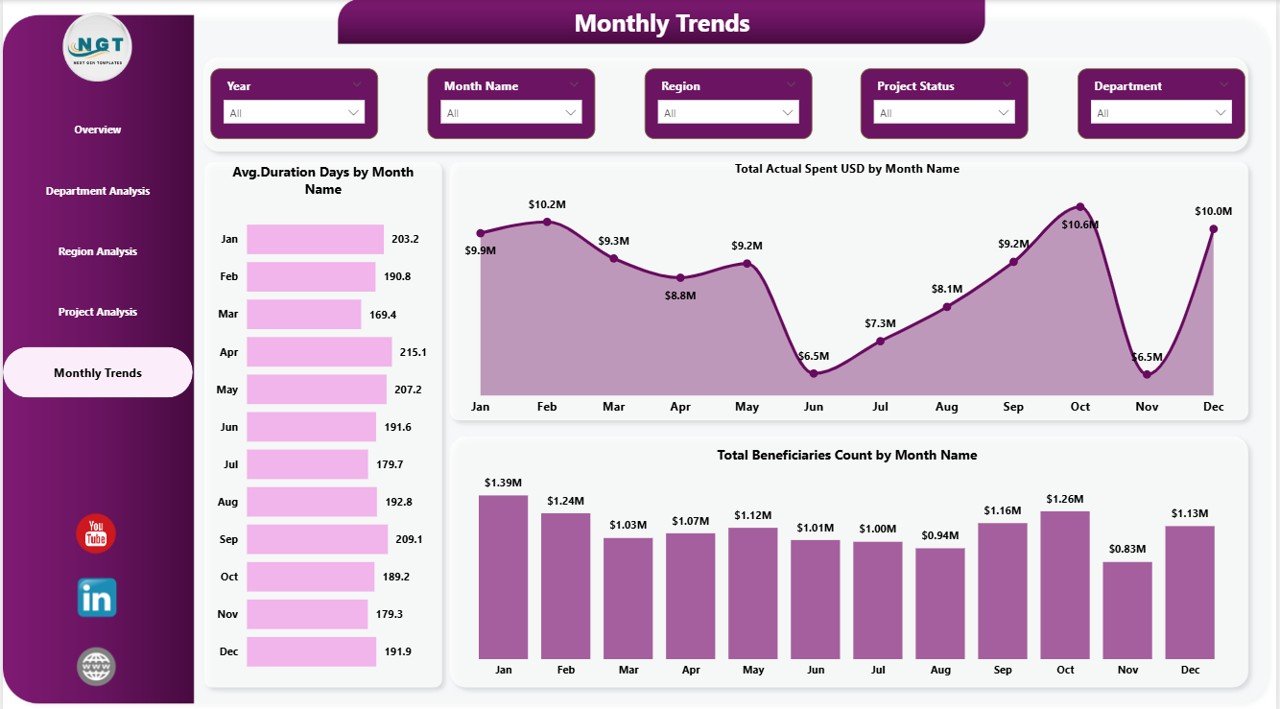
✅ Monthly trend analysis for forecasting and planning
✅ Dynamic slicers and filters for real-time insights
✅ Professional and executive-ready Power BI visuals
## 📦 What’s Inside the Government Administration Dashboard in Power BI
This digital product includes a fully structured Power BI dashboard containing five interactive analytical pages:
✔ Overview Page – High-level performance summary with KPI cards and executive charts
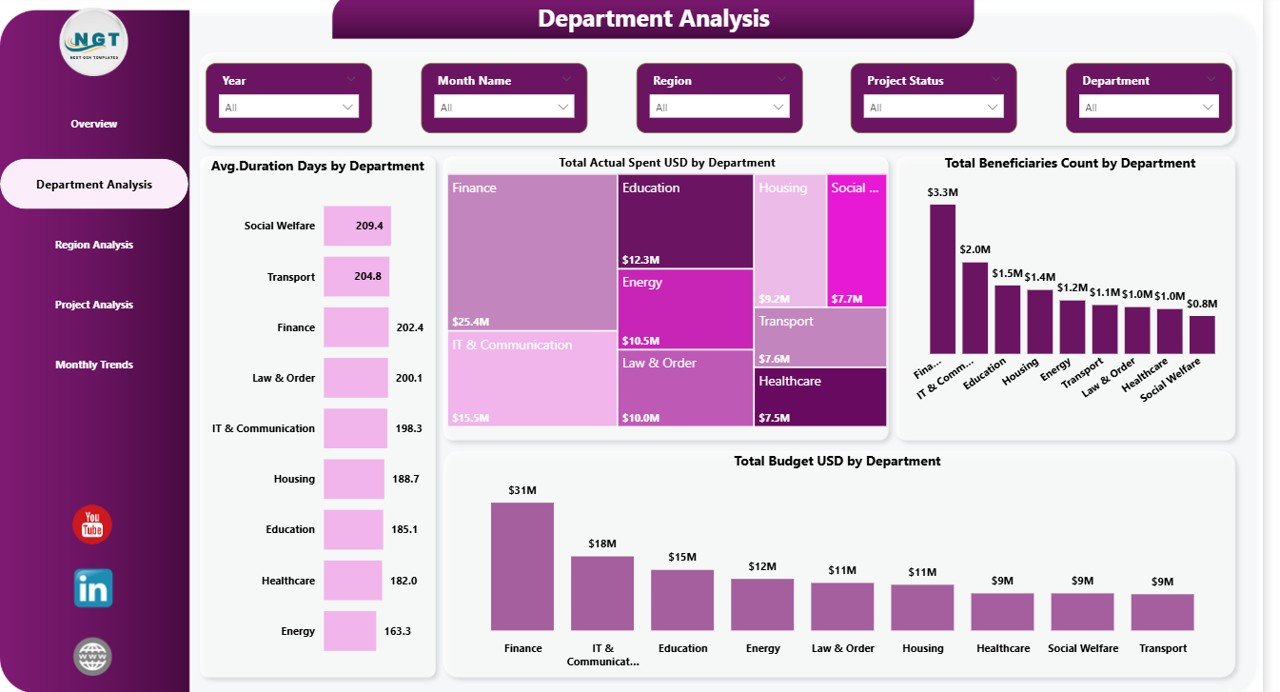
✔ Department Analysis – Compare spending, duration, and beneficiary reach across departments
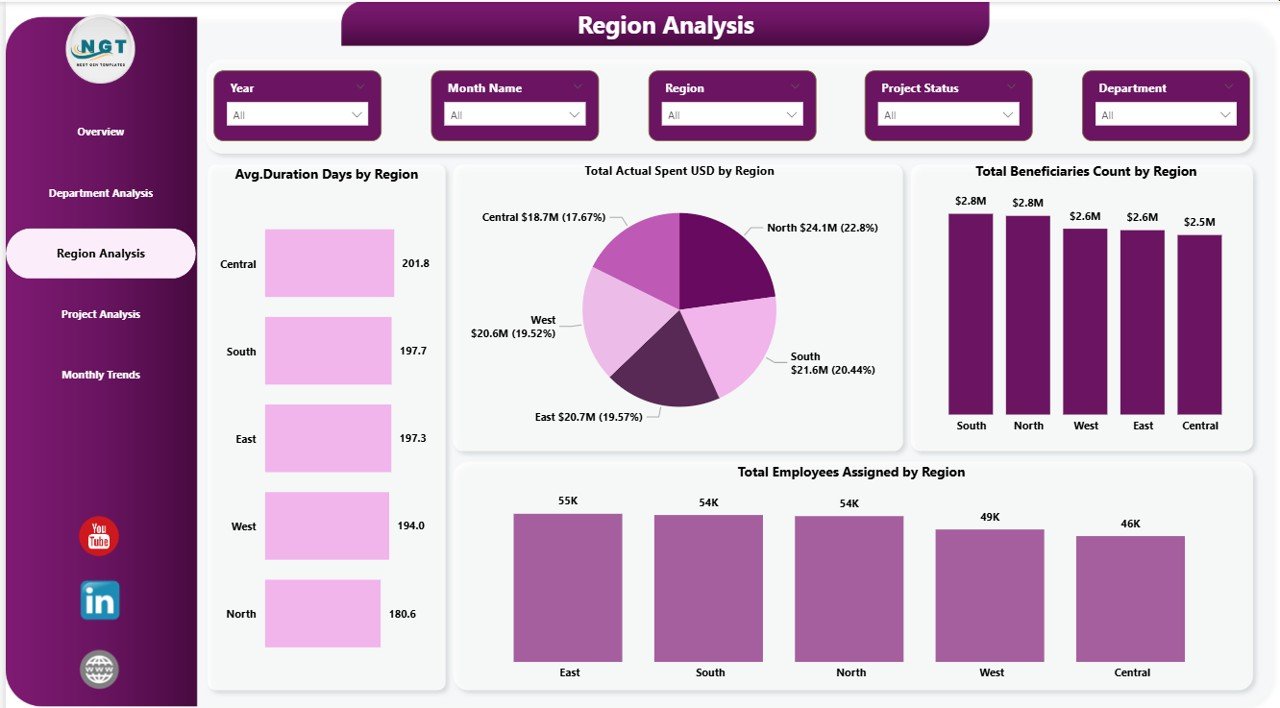
✔ Region Analysis – Evaluate regional development and workforce distribution
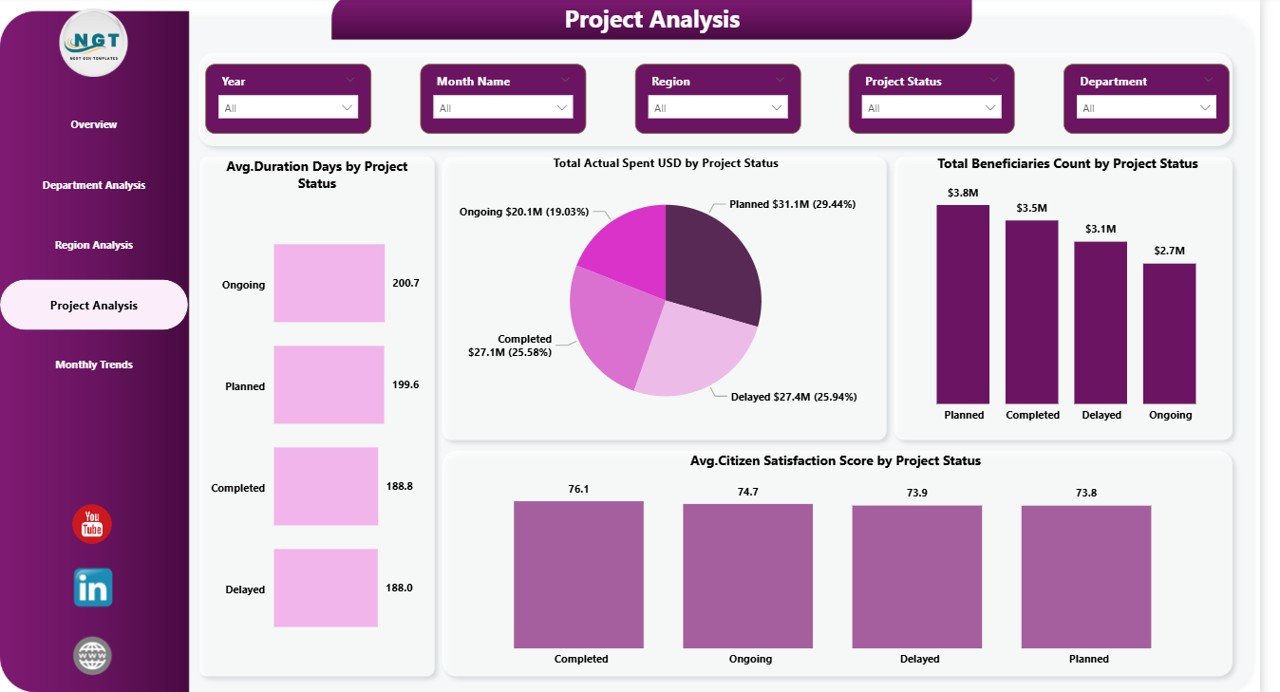
✔ Project Analysis – Monitor project status, spending efficiency, and satisfaction levels
✔ Monthly Trends – Analyze time-based performance patterns and implementation progress
The dashboard is professionally structured so decision-makers can instantly understand organizational performance.
## 🛠️ How to Use the Government Administration Dashboard in Power BI
Using this dashboard is simple and requires no advanced technical knowledge:
1️⃣ Open the Power BI file provided after download
2️⃣ Connect or replace sample data with your organization’s dataset
3️⃣ Refresh the dashboard to update visuals automatically
4️⃣ Use slicers to filter by department, region, project status, or time period
5️⃣ Analyze KPIs and trends to support better decision-making
Within minutes, users can start generating meaningful administrative insights.
## 👥 Who Can Benefit from This Government Administration Dashboard in Power BI
This dashboard is ideal for:
🏛 Government departments and public administration offices
📊 Policy makers and senior decision-makers
📁 Project managers managing development programs
📈 Data analysts and reporting teams
🌍 Regional administration authorities
🏥 Public service organizations (healthcare, education, infrastructure)
📚 Smart city and development initiative teams
Any organization managing large-scale public programs can use this dashboard to improve governance and operational transparency.The Government Administration Dashboard in Power BI helps institutions move beyond manual reporting toward data-driven governance. Leaders gain instant visibility into budgets, projects, departments, and citizen outcomes — enabling smarter decisions and improved public service delivery.
Instead of reacting to problems after they occur, organizations can proactively monitor performance and optimize resources using interactive analytics.
If your organization wants to enhance accountability, improve transparency, and modernize administrative reporting, this dashboard provides a ready-to-use and highly practical solution.
Click here to read the Detailed blog post
Watch the step-by-step video tutorial:


