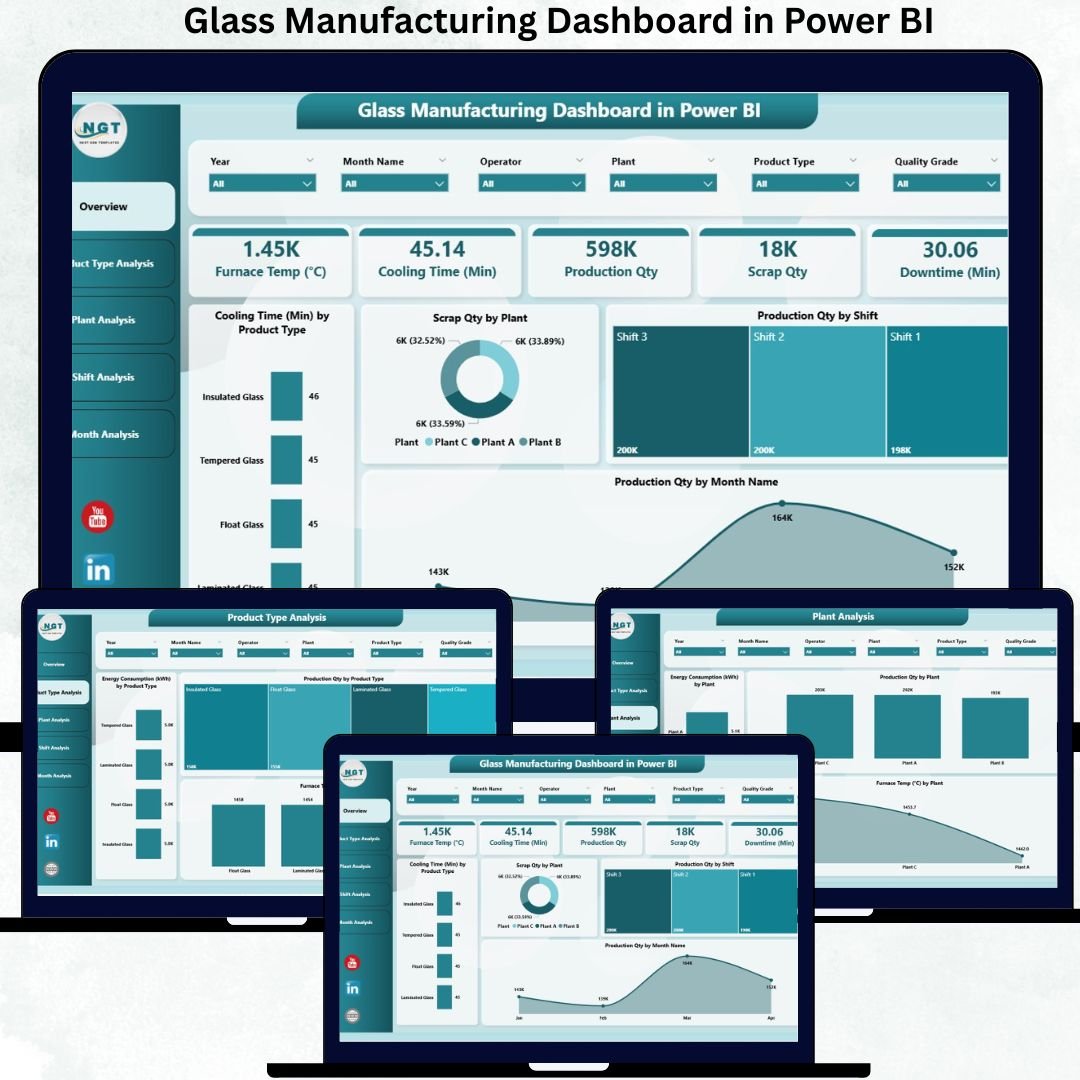
Running a glass manufacturing plant requires speed, precision, and constant monitoring. Production teams juggle multiple variables—energy consumption, furnace temperature, cooling time, scrap generation, downtime, and shift performance. Tracking these KPIs manually wastes time and leads to delayed decisions. That’s why every modern manufacturing unit needs a Glass Manufacturing Dashboard in Power BI.
This powerful dashboard converts raw production data into clean visuals, KPI cards, charts, slicers, and automated comparisons. Instead of scrolling through spreadsheets, managers get instant clarity on what is happening across plants, products, and shifts. Whether you want to reduce scrap, control energy usage, improve shift productivity, or plan maintenance smarter—this dashboard gives you everything in one place.
⚡ Key Features of Glass Manufacturing Dashboard in Power BI
This dashboard includes all the critical components required to manage glass manufacturing operations effectively.
🔥 Real-Time Overview Page
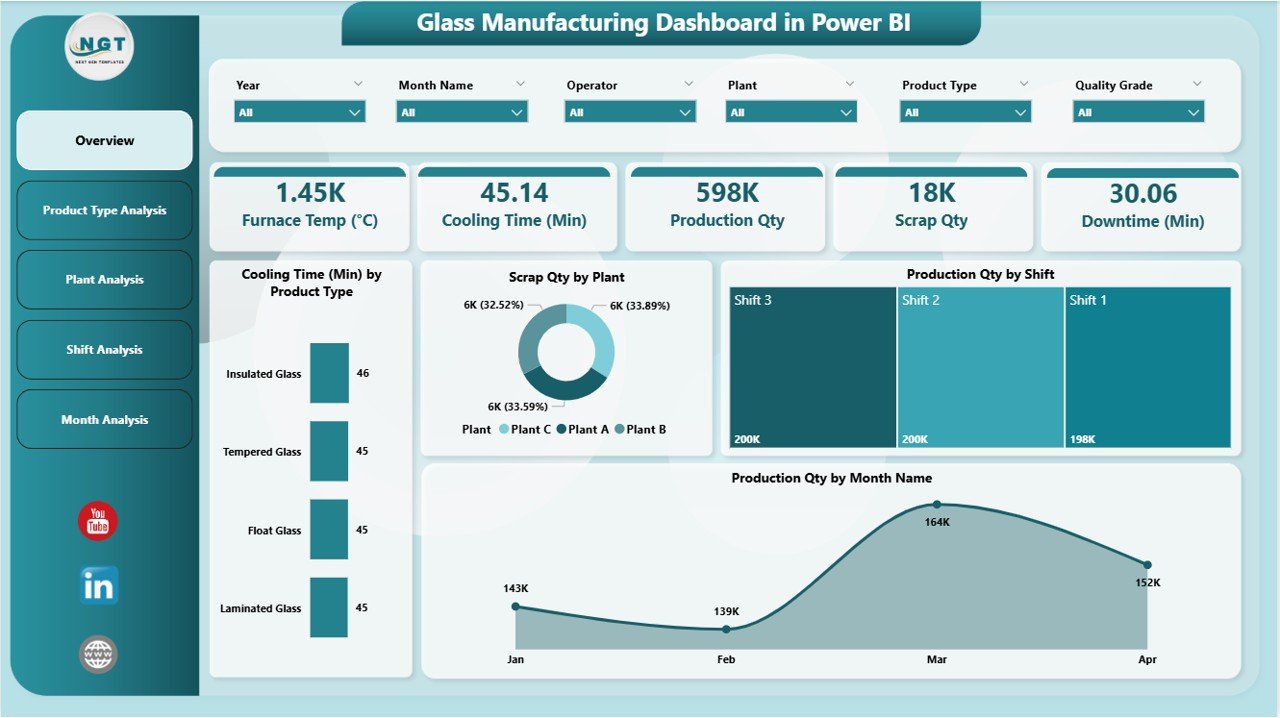
This page acts as the central control panel for plant leaders.
-
📊 KPI Cards display production volume, scrap quantity, cooling time, and energy usage instantly.
-
🧊 Cooling Time by Product Type helps identify products that require longer processing.
-
🏭 Scrap Quantity by Plant highlights wastage hotspots.
-
👷 Production by Shift compares the performance of Shift A, B, and C.
-
📅 Production by Month shows long-term trends to support planning and forecasting.
The entire page updates as soon as you change filters—making it your fastest decision-making tool during reviews and daily huddles.
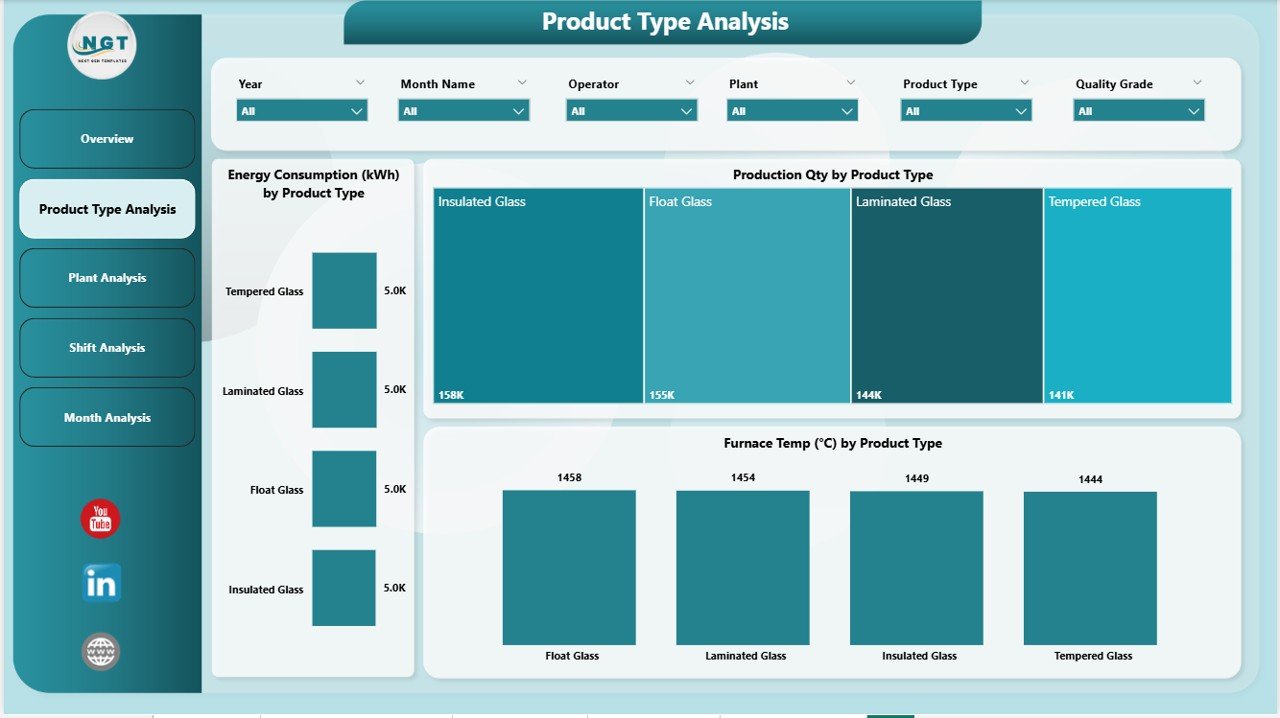
🧪 Product Type Analysis
Glass products differ in weight, shape, complexity, and cooling needs. This page helps you:
-
⚡ Compare energy consumption by product type
-
📦 Track production output for each product category
-
❄ Identify cooling time differences
This detailed view is perfect for cost management, production planning, and forecasting.
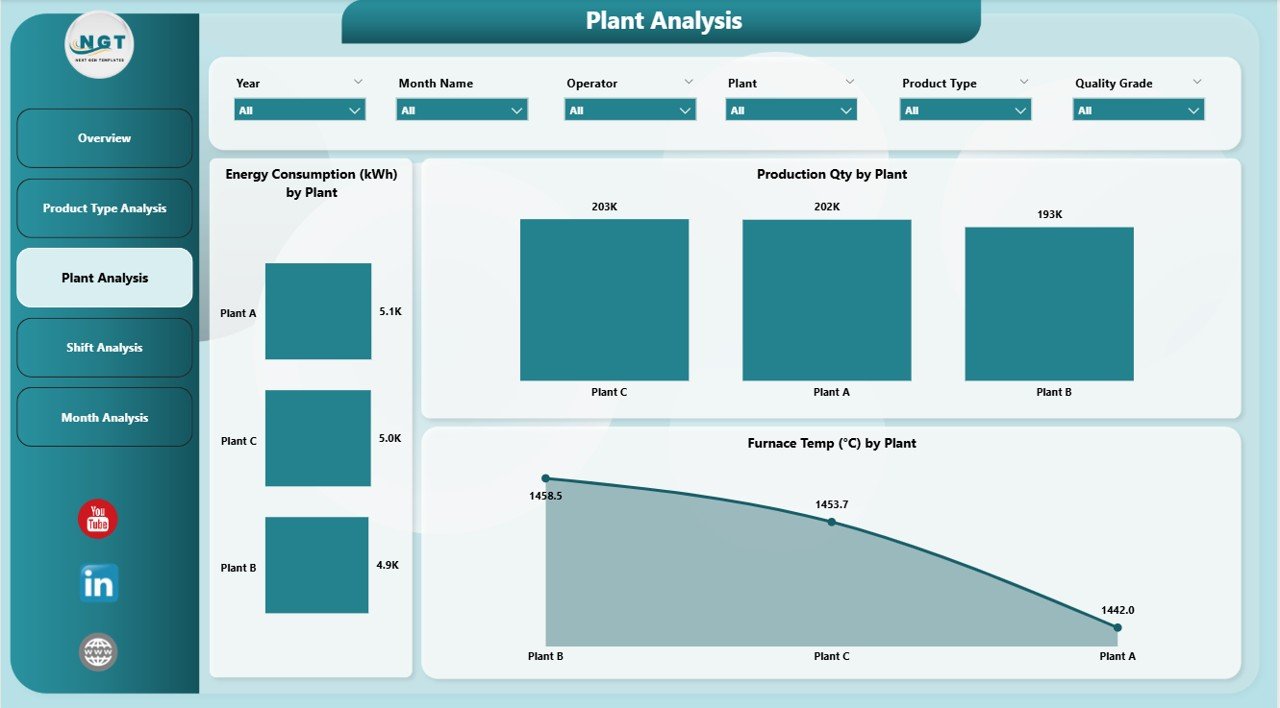
🏭 Plant Analysis Page
If you operate multiple plants, this page becomes essential.
-
⚡ Compare energy efficiency by plant
-
📈 Check production volume at each location
-
🔥 Review furnace performance and team efficiency
Leaders get the clarity needed for resource allocation, capacity planning, and identifying best-performing units.
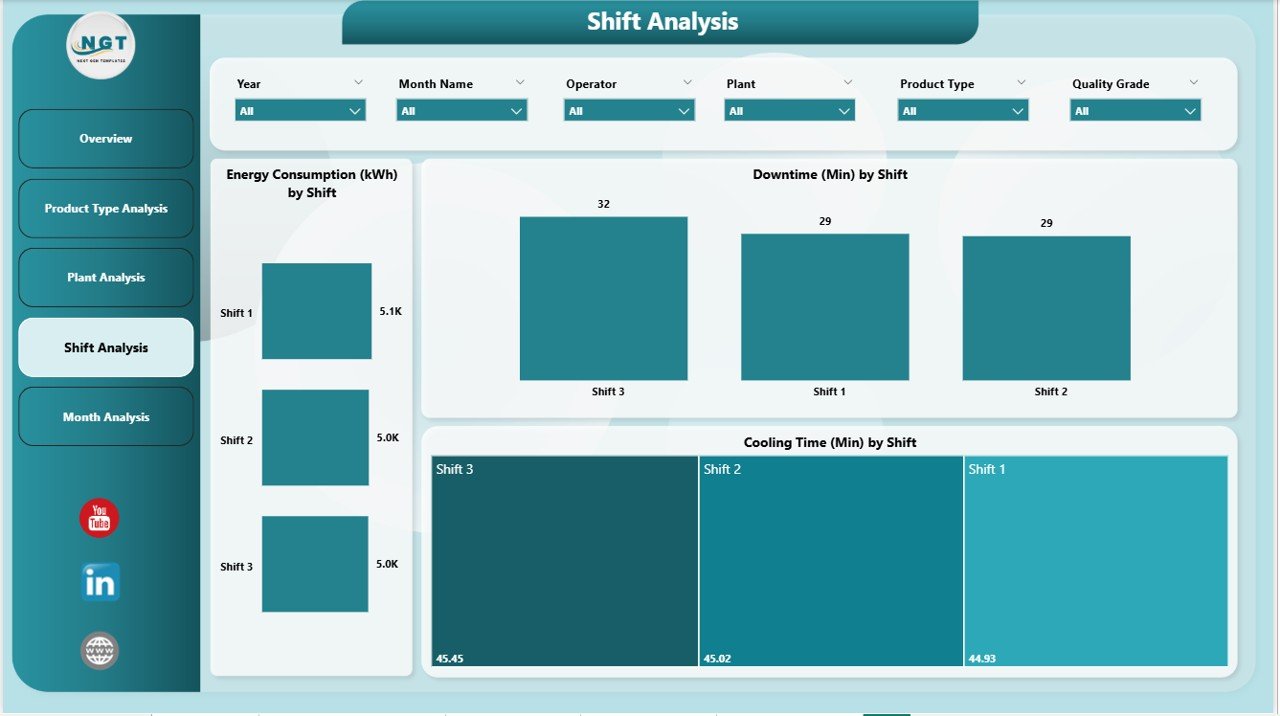
👷 Shift Analysis Page
Shift performance impacts daily output significantly. This page includes:
-
⚡ Energy usage by shift
-
⏳ Downtime by shift
-
❄ Cooling time by shift
Managers use this view to improve workforce productivity, reduce repeated issues, and optimize night/day shifts.
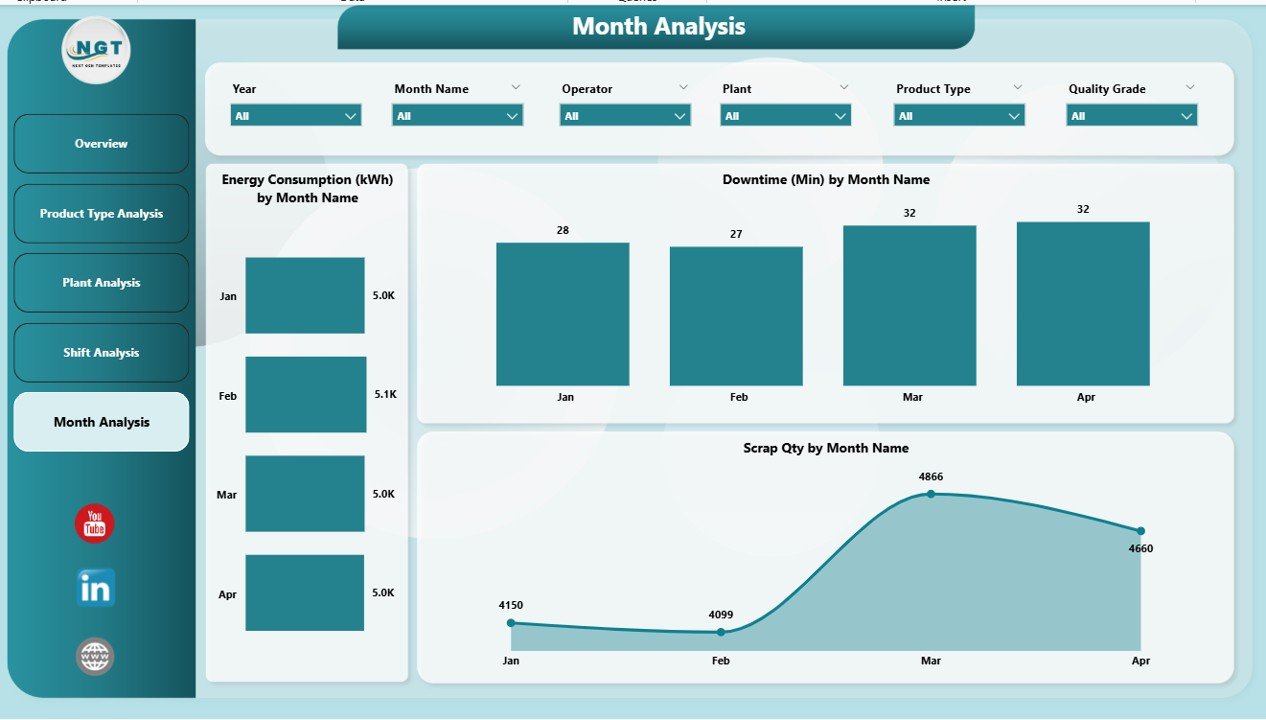
📅 Monthly Trends Page
This page shows complete historical performance, including:
-
⚡ Energy consumption
-
🕒 Downtime
-
🗑 Scrap quantity
Trend insights help leaders reduce losses, prepare budgets, and set accurate production targets.
📦 What’s Inside the Glass Manufacturing Dashboard in Power BI
When you download this digital product, you receive:
-
📁 Fully automated Power BI dashboard (.pbix)
-
📊 Structured Excel data source file
-
🗂 Five complete dashboard pages
-
🔧 Prebuilt KPIs: Scrap %, downtime, cooling time, furnace efficiency, shift performance, energy usage
-
🎛 Interactive slicers for plant, product type, shift, and month
-
⚡ Auto-refresh logic for real-time reporting
Everything is built using clean modeling and DAX logic to ensure fast performance and accurate insights.
🧭 How to Use the Glass Manufacturing Dashboard in Power BI
Getting started is incredibly simple:
1️⃣ Enter or paste your latest production, scrap, downtime, and energy data into the Excel file
2️⃣ Refresh Power BI
3️⃣ Select a plant, shift, product type, or month
4️⃣ View instant insights across all dashboard pages
5️⃣ Use trends & comparisons to make decisions
No coding. No advanced skills. Just refresh and analyze.
👥 Who Can Benefit from This Dashboard
This dashboard is built for every role involved in manufacturing operations:
-
🧑🏭 Plant Managers – oversee production & cost
-
🔧 Maintenance Teams – monitor downtime & optimize schedules
-
📊 Operations Leaders – track efficiency & performance gaps
-
⚡ Energy Managers – control consumption & reduce losses
-
🎯 Quality Teams – analyze scrap & improve process stability
-
🏢 Corporate Leadership – compare plants & drive strategic decisions
If your goal is improved productivity, reduced waste, and smarter reporting—this dashboard is your perfect solution.
### Click here to read the Detailed blog post
Visit our YouTube channel to learn step-by-step video tutorials
👉 Youtube.com/@PKAnExcelExpert


Reviews
There are no reviews yet.