

The esports and Gaming Esports KPI Dashboard moves at lightning speed ⚡. Every match, tournament, stream, and campaign generates massive amounts of performance data. However, without the right analytics structure, this data quickly becomes overwhelming. Many esports teams, managers, analysts, and investors still rely on scattered Excel files and manual reports. As a result, performance gaps remain hidden, trends go unnoticed, and decisions become reactive.
That is exactly where the Gaming Esports KPI Dashboard in Power BI becomes a game-changing analytics solution 🏆.
This ready-to-use Power BI dashboard is designed to help esports organizations track, analyze, and visualize KPIs in one centralized and interactive platform. Instead of switching between spreadsheets and reports, you get a single source of truth for esports performance.
The dashboard uses Excel as the data source and Power BI as the visualization layer, which means data entry stays simple while insights remain powerful. With MTD, YTD, Target vs Actual, Previous Year comparisons, trend charts, and KPI definitions, this dashboard delivers professional-grade analytics without technical complexity.
Whether you manage an esports team, run tournaments, analyze performance, or report to sponsors, this dashboard helps you turn raw gaming data into strategic advantage 🚀.
🔑 Key Features of Gaming Esports KPI Dashboard in Power BI
📊 Centralized KPI Monitoring for Esports
🎯 MTD & YTD Performance Tracking
📈 Target vs Actual & Year-over-Year Comparison
⬆️⬇️ Visual Performance Indicators (UTB & LTB)
📉 Interactive KPI Trend Analysis
🧩 Drill-Through KPI Definition Page
🖱️ Dynamic Slicers for Fast Filtering
⚙️ Excel-Based Data Input & Easy Refresh
📂 What’s Inside the Gaming Esports KPI Dashboard in Power BI
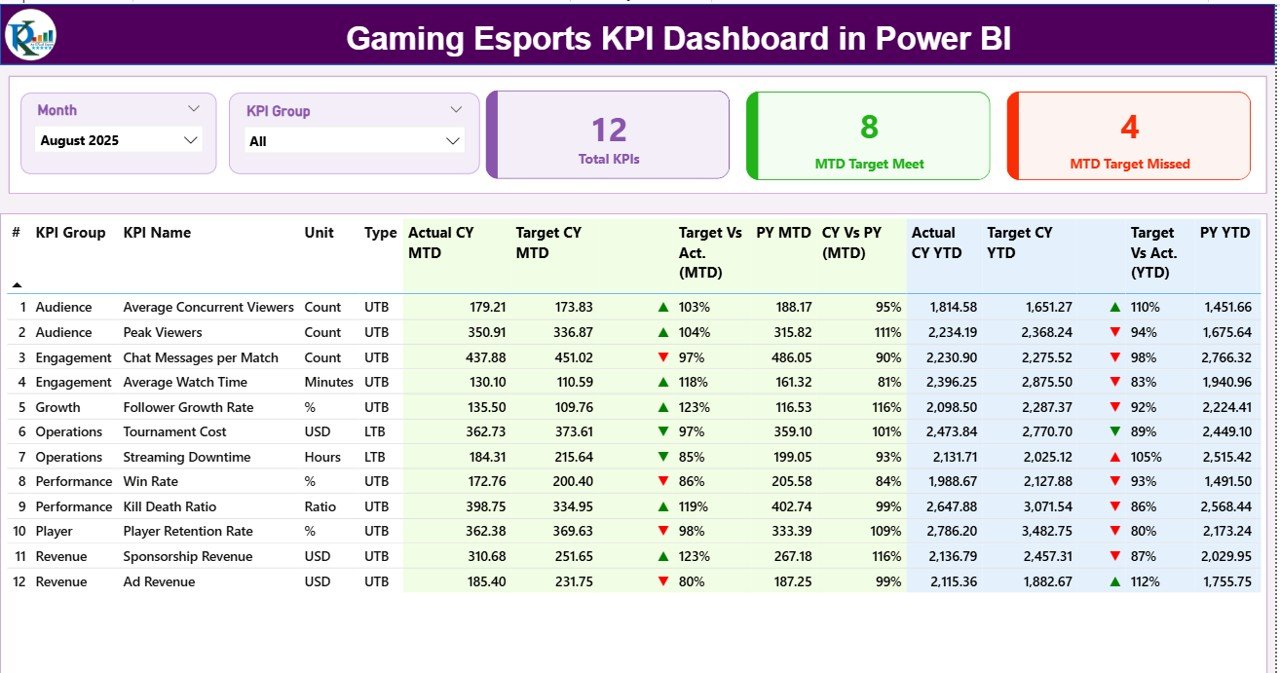
📊 Summary Page – Performance Control Center
Gaming Esports KPI Dashboard
The Summary Page acts as the heart of the dashboard.
What you get:
-
Month slicer for period selection
-
KPI Group slicer for category-wise analysis
-
KPI cards showing:
-
Total KPIs Count
-
MTD Target Met Count
-
MTD Target Missed Count
-
Below the cards, a detailed KPI table displays:
-
KPI Name, Group, Unit, Type (UTB / LTB)
-
Actual vs Target (MTD & YTD)
-
Previous Year comparison
-
Automatic green/red ▲▼ indicators
This page gives decision-makers an instant performance snapshot.
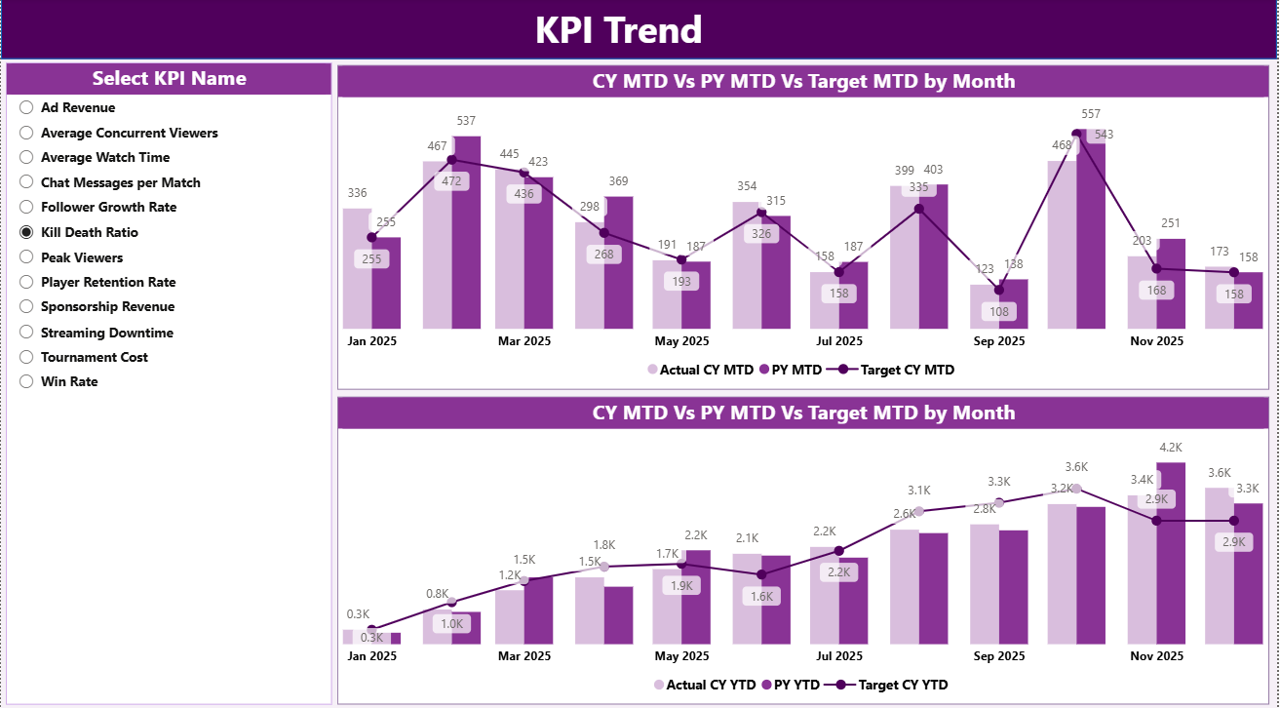
📈 KPI Trend Page – Performance Over Time
The KPI Trend Page focuses on trend-based analysis.
Key capabilities:
-
KPI selection using slicer
-
MTD Trend chart (Actual vs Target vs PY)
-
YTD Trend chart (Actual vs Target vs PY)
With these visuals, teams identify growth patterns, volatility, and seasonal changes early.
📘 KPI Definition Page – Single Source of Truth
The KPI Definition Page improves transparency and consistency.
It shows:
-
KPI Number
-
KPI Group
-
KPI Name
-
Unit
-
Formula
-
KPI Definition
-
KPI Type (UTB / LTB)
This page works as a drill-through view, ensuring everyone interprets KPIs correctly.
⚙️ How to Use the Gaming Esports KPI Dashboard in Power BI
1️⃣ Enter actual values in Excel
2️⃣ Define targets and KPI logic
3️⃣ Refresh the Power BI dashboard
4️⃣ Filter by month or KPI group
5️⃣ Analyze trends and gaps
6️⃣ Make data-driven decisions
No coding. No complex setup. Just insights.
🎯 Who Can Benefit from This Dashboard?
🎮 Esports Teams & Managers
🧠 Coaches & Performance Analysts
🏆 Tournament Organizers
📊 Gaming & Esports Startups
🤝 Sponsors & Investors
📈 Senior Management
### 👉 Click here to read the Detailed blog post
▶️ Visit our YouTube channel to learn step-by-step video tutorials
https://youtube.com/@PKAnExcelExpert


Reviews
There are no reviews yet.