Furniture retail is no longer driven only by showroom displays and footfall. Today, data defines success. Retailers must continuously track sales, profit, discounts, stores, regions, product categories, and monthly trends to stay competitive. However, when this information sits across multiple spreadsheets or static reports, decision-making becomes slow, reactive, and risky.
That is exactly where the Furniture Retail Dashboard in Power BI becomes a powerful growth solution 🛋️📊.
This ready-to-use Power BI dashboard transforms raw furniture retail data into clear KPIs, interactive visuals, and real-time insights. Instead of manually compiling reports, store managers and executives get a single, centralized view of retail performance—updated instantly with slicers and filters.
Built for speed, clarity, and control, this dashboard helps furniture retailers move from guesswork to data-driven decisions.
## Key Features of Furniture Retail Dashboard in Power BI 🚀
This dashboard is designed to simplify complex retail analysis.
📊 Centralized Retail Performance Monitoring
Track sales, profit, discounts, stores, regions, and product categories in one dashboard.
🎛️ Interactive Power BI Slicers
Filter insights instantly by month, store, region, or product category.
📈 Executive KPI Cards
View critical performance indicators at a glance for faster decisions.
📉 Discount Impact Analysis
Understand how discounts affect profitability at store and category level.
🏬 Store-Wise Performance Insights
Compare stores easily to identify top performers and underperformers.
🌍 Region-Wise Analytics
Analyze regional performance to support expansion and optimization strategies.
📅 Monthly Trend Tracking
Monitor seasonality, promotions, and demand patterns over time.
⚡ Scalable Power BI Solution
Handles large retail datasets efficiently without performance issues.
## What’s Inside the Furniture Retail Dashboard in Power BI 📂
This dashboard includes five well-structured Power BI pages, each answering a key retail question.
🟦 Overview Page
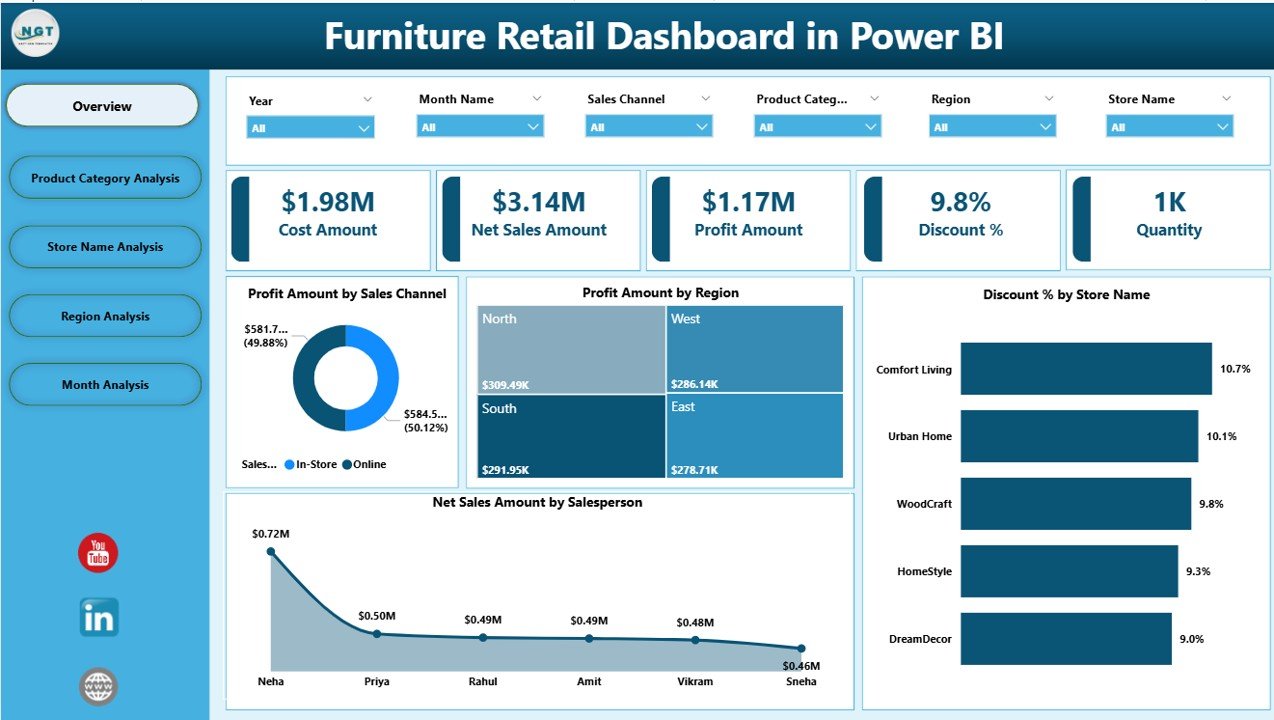
Acts as the command center with high-level KPIs and visuals such as Profit by Sales Channel, Profit by Region, Discount % by Store, and Net Sales by Salesperson.
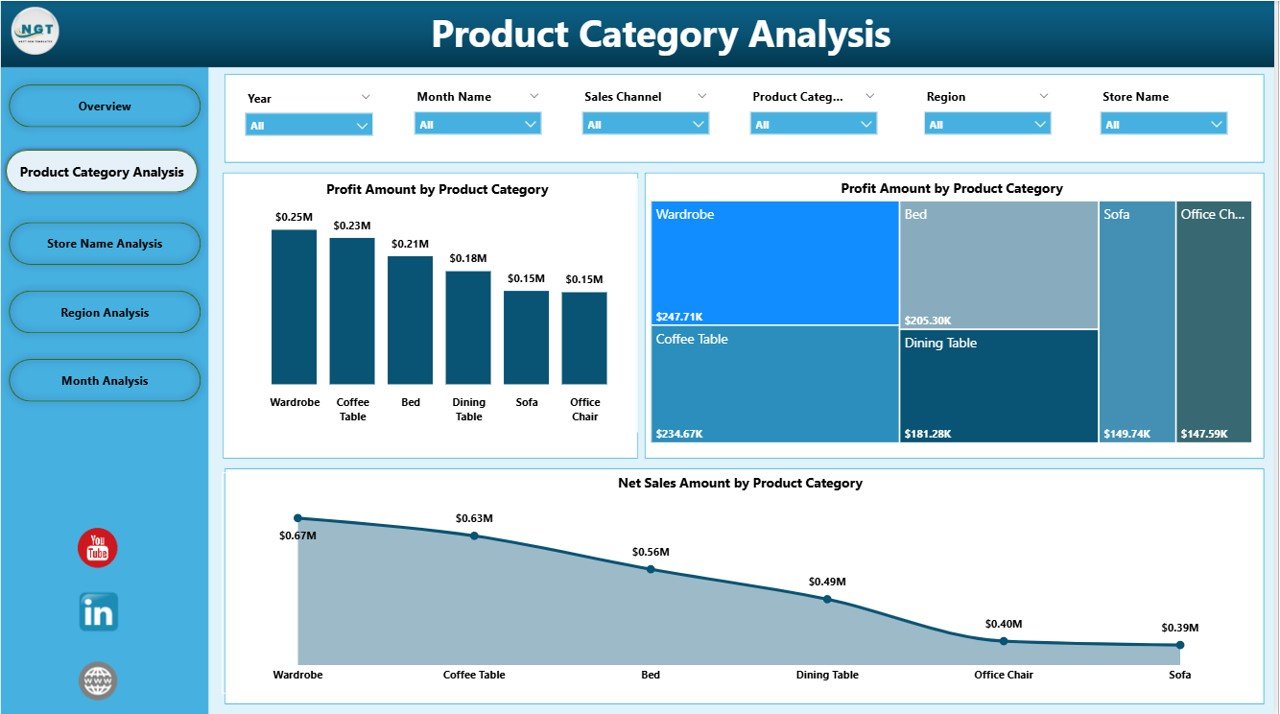
🟦 Product Category Analysis Page
Compares profit, net sales, and discount percentage across furniture categories like sofas, beds, tables, and chairs.
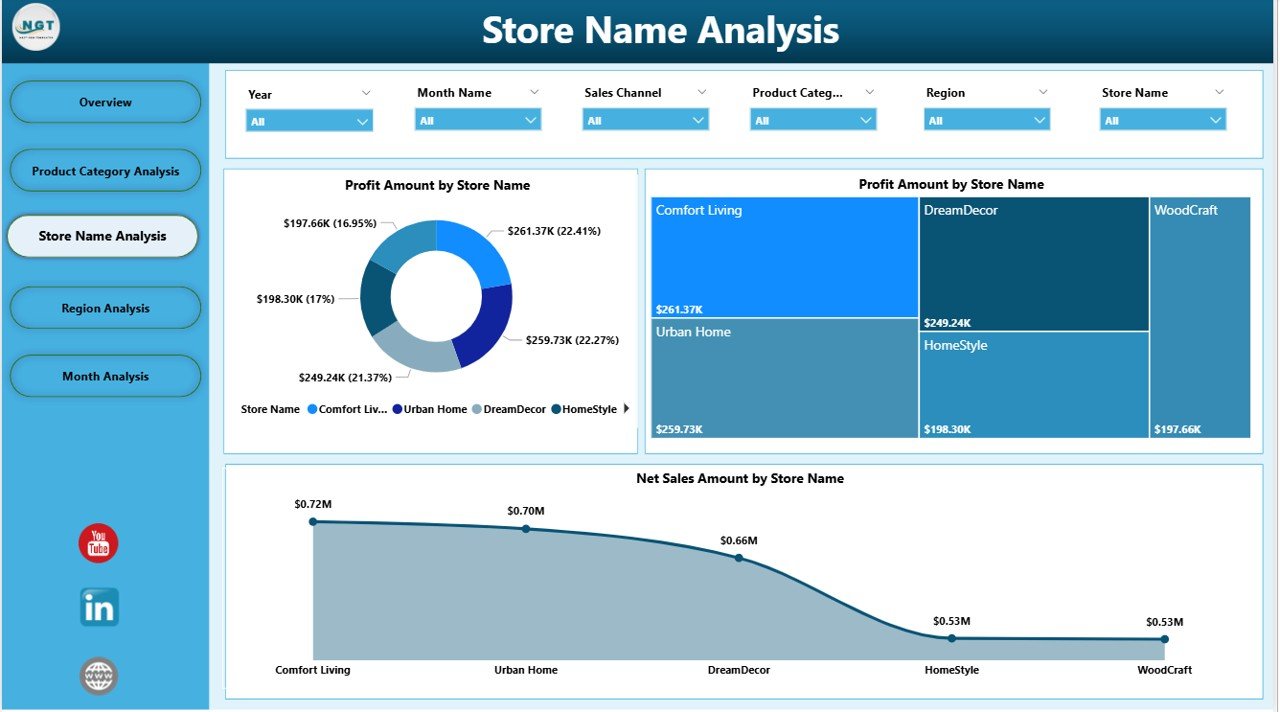
🟦 Store Name Analysis Page
Provides store-level insights for profit, discounts, and net sales to improve accountability and performance.
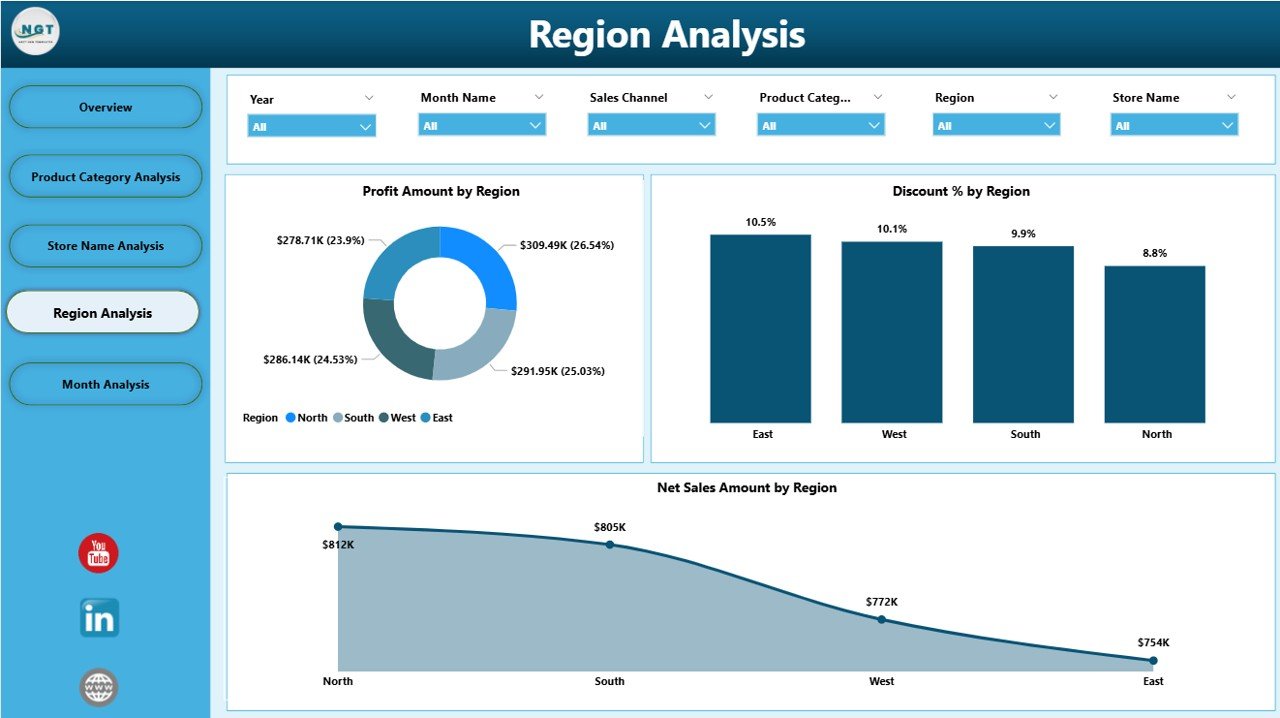
🟦 Region Analysis Page
Highlights regional differences in profit, discounts, and sales to support strategic planning.
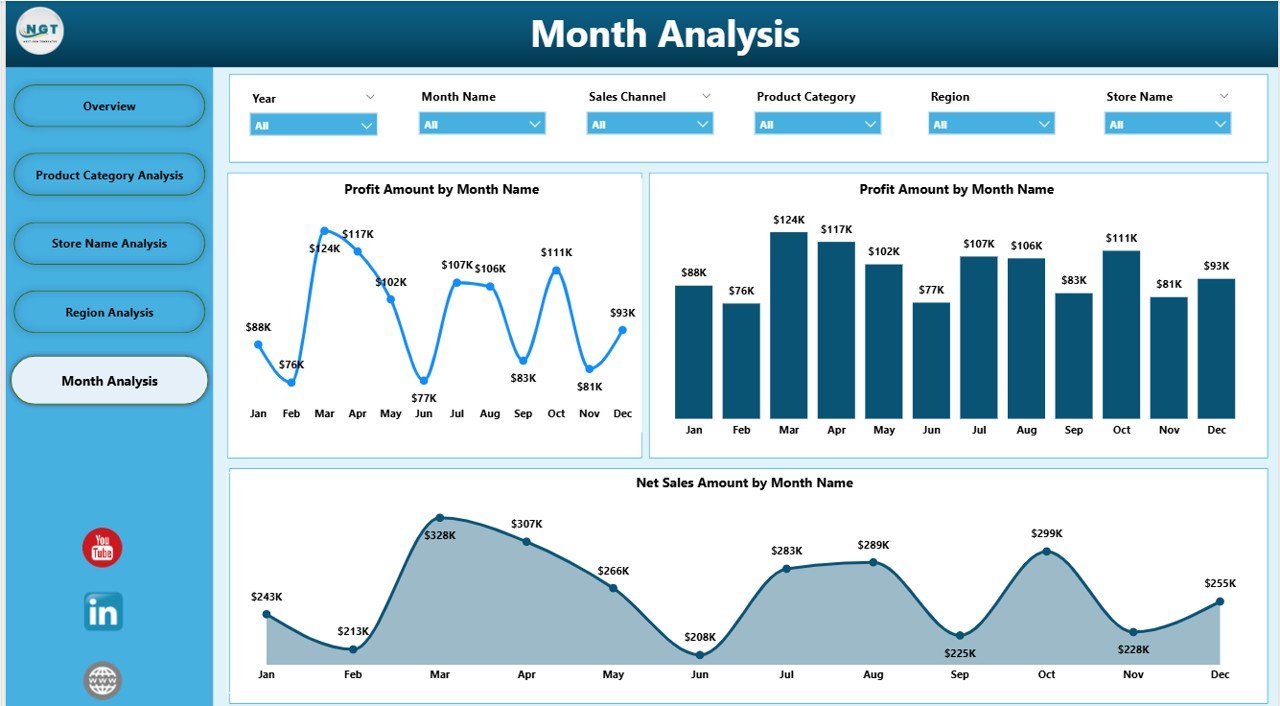
🟦 Month Analysis Page
Tracks monthly trends for profit, discounts, and net sales to identify seasonality and campaign impact.
Together, these pages deliver a complete furniture retail analytics framework.
## How to Use the Furniture Retail Dashboard in Power BI 🧩
Using this dashboard is simple and efficient:
1️⃣ Load or connect your furniture retail data
2️⃣ Refresh the Power BI report
3️⃣ Apply slicers to filter by store, region, category, or month
4️⃣ Review KPIs, charts, and trends instantly
5️⃣ Use insights to improve pricing, discount control, and store strategy
Power BI handles all calculations automatically, so teams focus on action—not reporting.
## Who Can Benefit from This Furniture Retail Dashboard in Power BI 👥
This dashboard is ideal for:
✔️ Furniture Retail Business Owners
✔️ Store & Regional Managers
✔️ Sales & Operations Teams
✔️ Finance & Profitability Analysts
✔️ Retail Consultants
✔️ Executive Leadership
Both technical and non-technical users can confidently use this dashboard.
### Click here to read the Detailed blog post
Visit our YouTube channel to learn step-by-step video tutorials
👉 YouTube.com/@PKAnExcelExpert


Reviews
There are no reviews yet.