Freight Forwarding Dashboard operations are getting more complex every day. Shipment volumes are rising, costs fluctuate constantly, customer expectations are higher than ever, and margins remain under pressure. Yet many logistics teams still rely on scattered Excel files, manual reports, and delayed insights. As a result, decision-making becomes slow, errors increase, and profitability suffers.
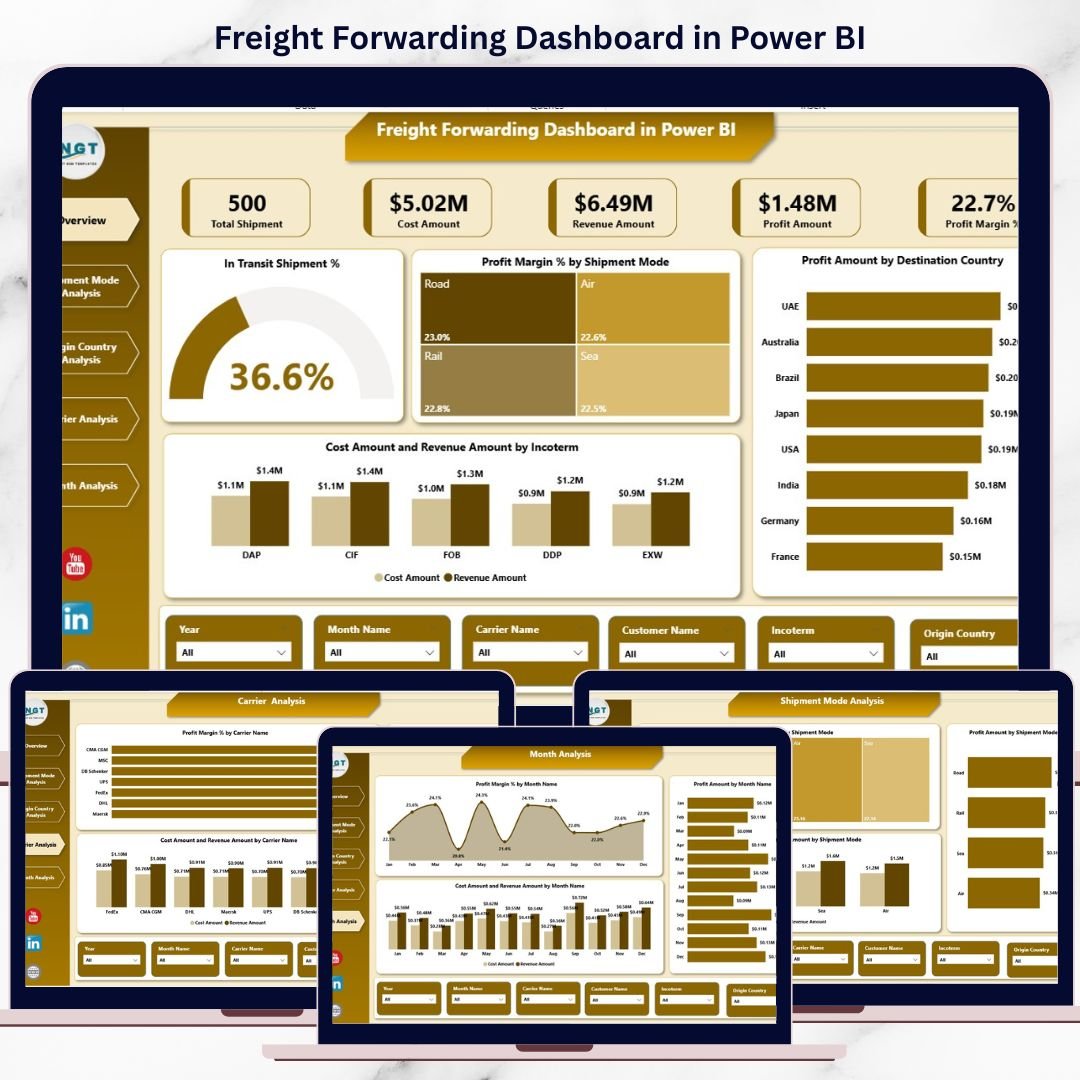
The Freight Forwarding Dashboard in Power BI is a ready-to-use, interactive analytics solution designed to bring complete operational and financial visibility into one powerful dashboard. Instead of chasing multiple reports, you get real-time insights into shipments, transit performance, costs, revenue, profit margins, carriers, shipment modes, countries, and monthly trends.
This dashboard helps freight forwarders move from reactive firefighting to proactive, data-driven logistics management.
🚀 Key Features of Freight Forwarding Dashboard in Power BI
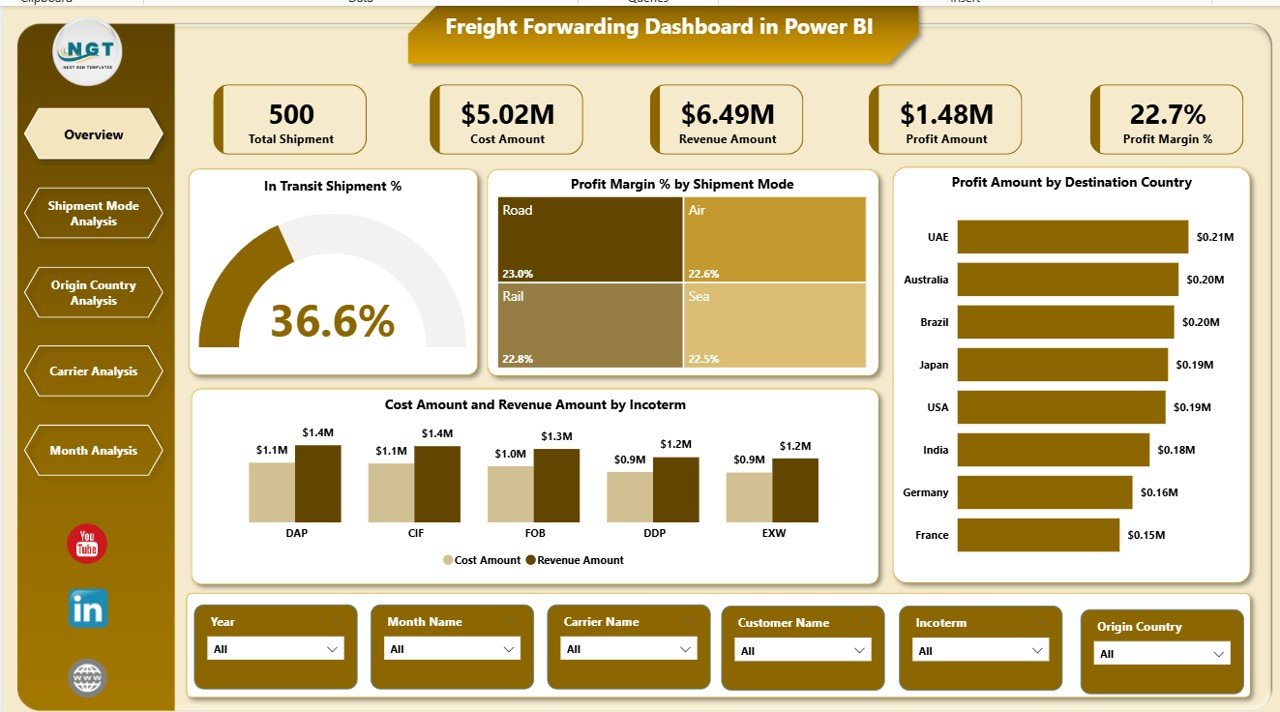
📊 Centralized Freight Performance View – Monitor shipments, revenue, costs, and margins from one dashboard
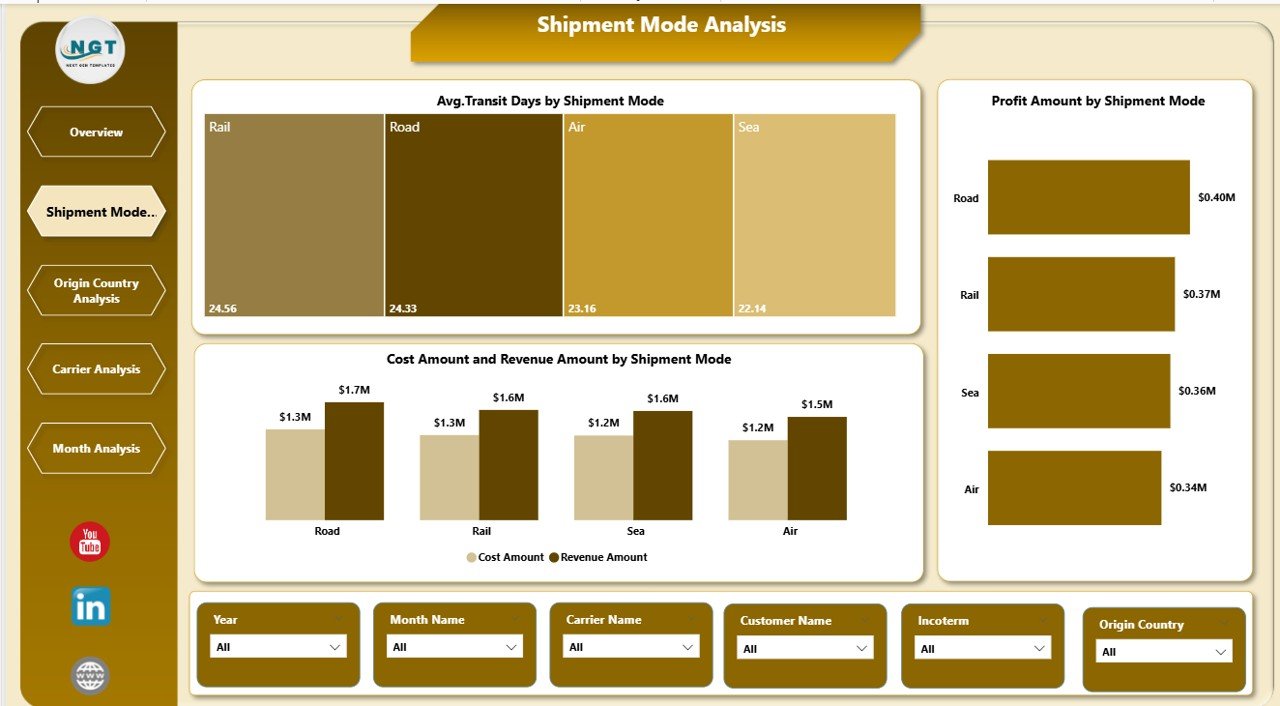
🚚 Shipment Mode Analysis – Compare air, sea, and road shipments by cost, transit time, and profitability
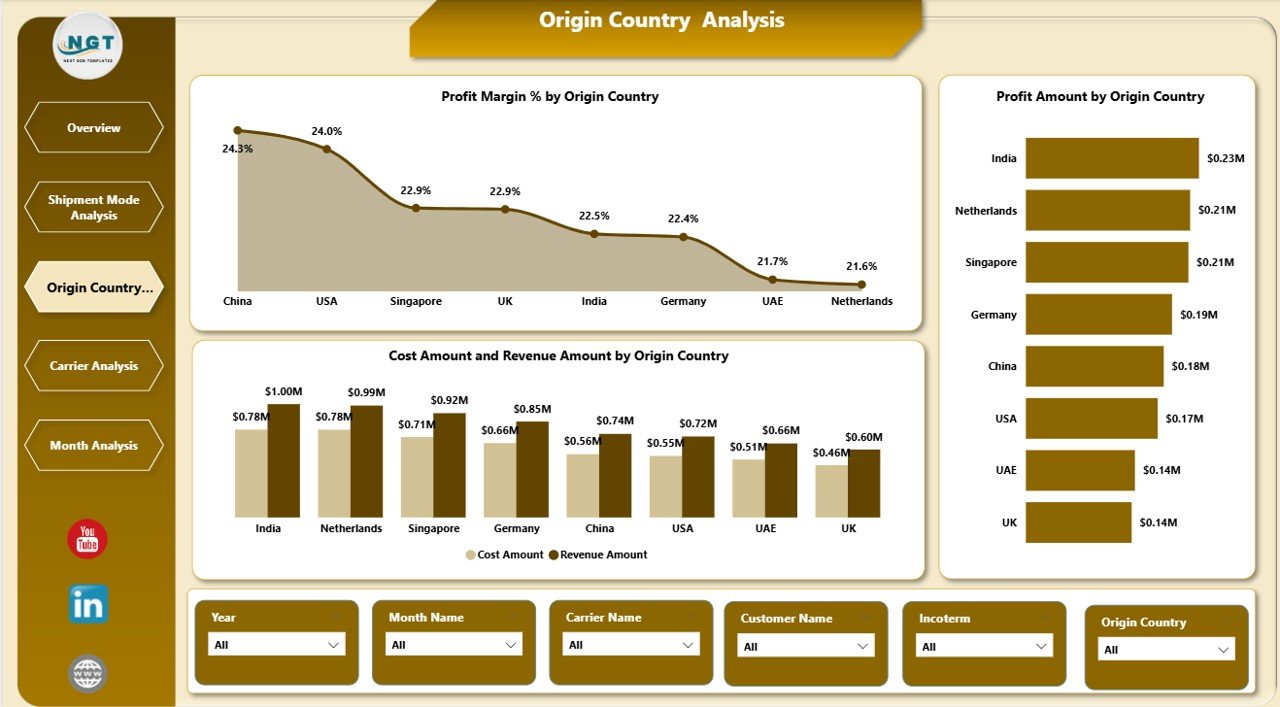
🌍 Origin Country Performance Tracking – Identify high-margin and low-margin shipment origins
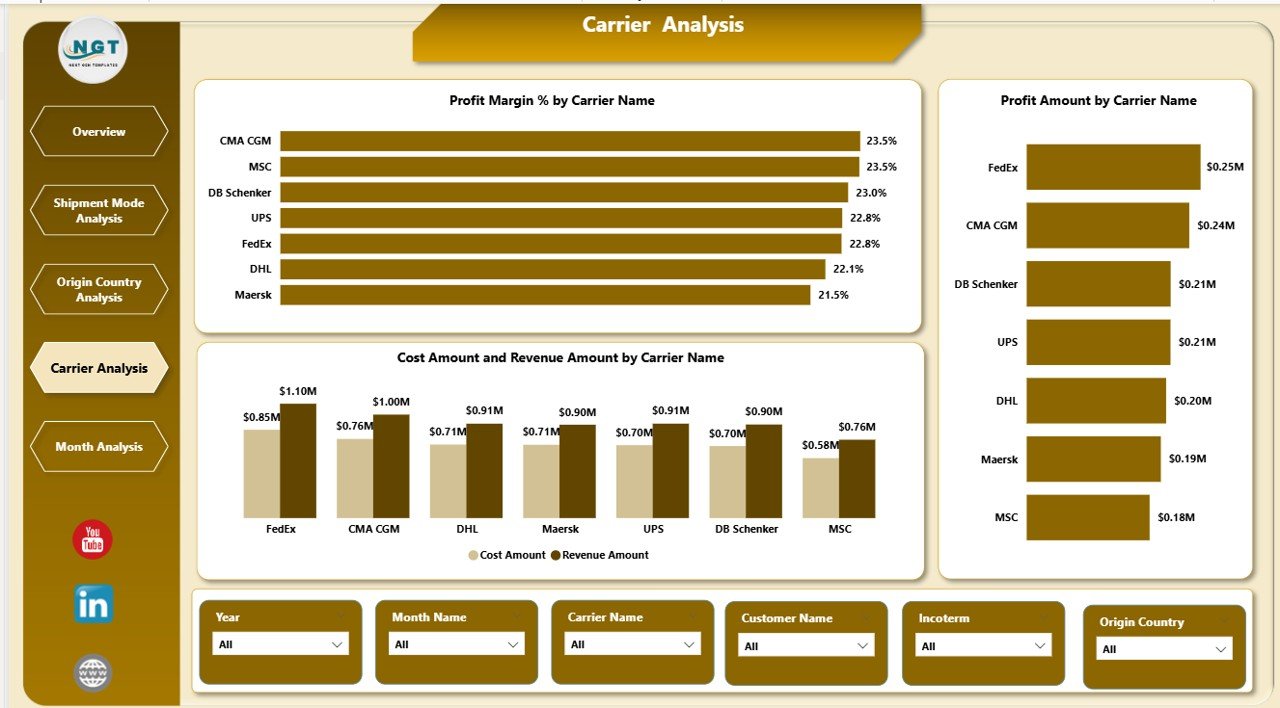
🤝 Carrier Performance Analysis – Evaluate carriers based on profit, cost, and revenue contribution
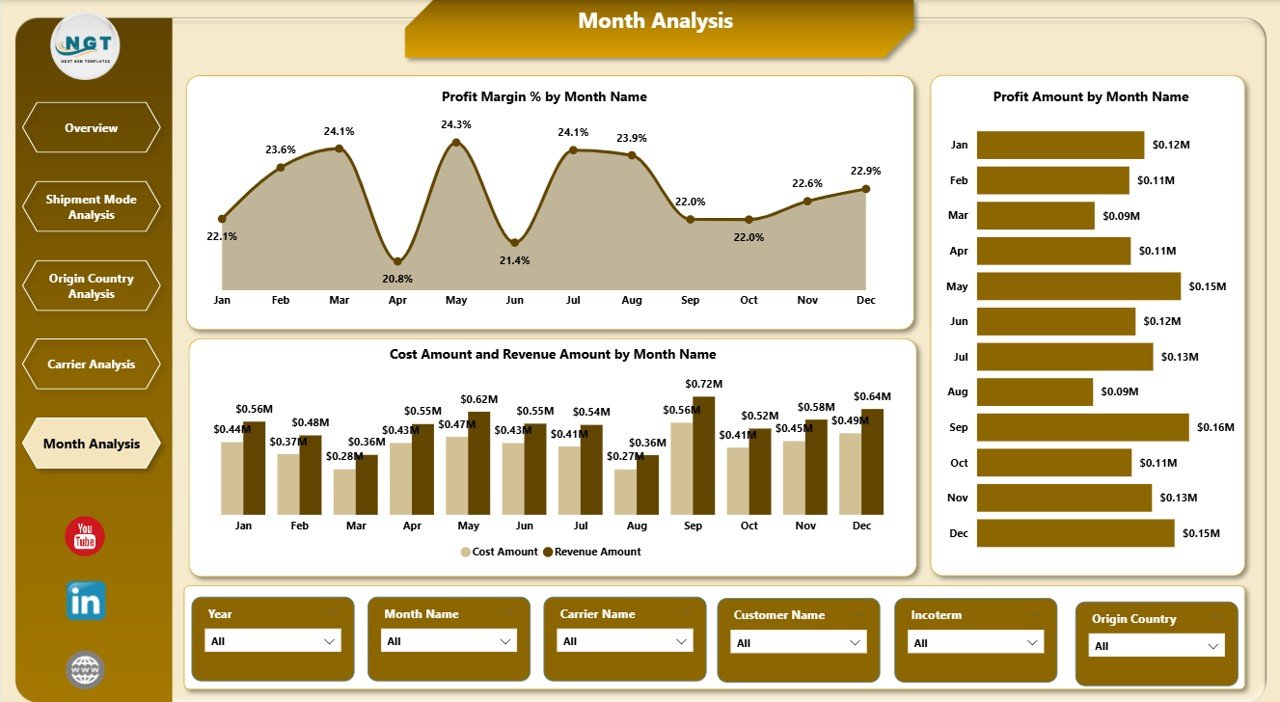
📈 Monthly Trend Monitoring – Track seasonality, demand changes, and margin fluctuations
🔄 Automatic Data Refresh – Update your data once and refresh Power BI to update all visuals
🎯 Business-Focused KPIs – Designed for operations, finance, and management teams
🧭 Interactive Slicers – Filter data by shipment mode, country, carrier, incoterm, or month instantly
📦 What’s Inside the Freight Forwarding Dashboard in Power BI
📁 Power BI (.pbix) File with a fully designed freight analytics dashboard
📄 Overview Page with KPI cards and high-level operational insights
🚛 Shipment Mode Analysis Page for air, sea, and road performance comparison
🌎 Origin Country Analysis Page for route and country-wise profitability
🤝 Carrier Analysis Page to evaluate logistics partners
📅 Monthly Trends Page for time-based performance tracking
📊 Clean & Structured Data Model ready for customization
⚙️ Professional Visual Design focused on clarity and usability
🧠 How to Use the Freight Forwarding Dashboard in Power BI
1️⃣ Open the provided Power BI file
2️⃣ Connect your Excel or database freight data
3️⃣ Map shipment, cost, revenue, carrier, country, and date fields
4️⃣ Refresh the Power BI dashboard
5️⃣ Use slicers to analyze performance by mode, carrier, country, or month
6️⃣ Identify issues, optimize routes, and improve profitability
No advanced Power BI expertise is required. The dashboard is easy to navigate and business-friendly.
👥 Who Can Benefit from This Freight Forwarding Dashboard in Power BI
🚢 Freight Forwarding Companies – Gain full operational and financial visibility
📦 Logistics & Supply Chain Managers – Optimize routes, carriers, and shipment modes
💰 Finance & Profitability Teams – Track margins, costs, and revenue leakage
🤝 Carrier Management Teams – Evaluate and improve carrier partnerships
👔 Business Owners & Executives – Monitor performance and make strategic decisions
Whether you are a small freight forwarder or a large logistics operator, this dashboard scales with your business needs.
🔗 Click here to read the Detailed Blog Post
🎥 Visit our YouTube channel to learn step-by-step video tutorials
https://www.youtube.com/@PKAnExcelExpert


Reviews
There are no reviews yet.