Freight cost management is one of the most critical responsibilities in logistics and supply chain operations. Transport charges fluctuate frequently, fuel prices rise unexpectedly, shipment delays add hidden costs, and inaccurate manual tracking can lead to major financial losses. To overcome these challenges, the Freight Cost KPI Dashboard in Google Sheets gives your team a smart, structured, and automated way to track all key performance indicators (KPIs) related to freight expenses.Freight Cost KPI Dashboard in Google Sheets
This ready-to-use dashboard helps logistics managers, supply chain leaders, warehouse teams, and business owners monitor monthly and yearly freight performance with precision. You can compare Month-to-Date (MTD) and Year-to-Date (YTD) numbers, analyze performance against targets, review previous year (PY) data, and understand trends instantly. As a result, your decision-making becomes faster, clearer, and more accurate.Freight Cost KPI Dashboard in Google Sheets

✨ Key Features of the Freight Cost KPI Dashboard in Google Sheets
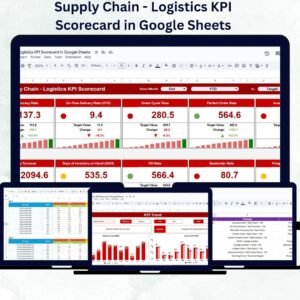
📌 1. Dashboard Sheet – Complete Freight Performance View
The Dashboard Sheet is the central view of the system. When you select a month from the dropdown (Cell D3), the entire dashboard updates instantly.
It displays:
-
MTD Actual
-
MTD Target
-
MTD Previous Year (PY)
-
Target vs Actual
-
PY vs Actual
For yearly comparisons, you also see:
-
YTD Actual
-
YTD Target
-
YTD Previous Year
-
YTD Target vs Actual
-
YTD PY vs Actual
Up/down arrows powered by conditional formatting highlight whether your cost performance is improving or declining. This makes the dashboard visual, intuitive, and decision-ready.
📈 2. KPI Trend Sheet – Complete KPI Reference & Analysis
The KPI Trend sheet shows detailed information about any KPI you choose from the dropdown in Cell C3.
It displays:
-
KPI Group
-
KPI Unit
-
KPI Type (UTB – Upper The Better, LTB – Lower The Better)
-
KPI Formula
-
KPI Definition
This allows teams to understand exactly how each metric is calculated and promotes consistent KPI usage across departments.
🧮 3. Actual Number Sheet – Input Real Freight Cost Data
This sheet helps you enter MTD and YTD actual data for all KPIs. You simply select the month from Cell E1 and enter the numbers for that period. Everything else updates automatically on the dashboard.
It ensures that your data stays accurate, real-time, and aligned with monthly reporting needs.
🎯 4. Target Sheet – Set Monthly KPI Goals
This section allows you to enter monthly:
-
MTD Targets
-
YTD Targets
Targets form the backbone of performance measurement. Once set, the dashboard automatically compares actual numbers against expectations—highlighting gaps and progress.
📊 5. Previous Year Sheet – Track Year-over-Year Improvement
This sheet stores previous year’s KPI data in the same monthly structure as the current year.
The dashboard uses this reference to calculate PY vs Actual values, which helps identify whether your freight performance is improving or declining.
Year-over-year comparisons are essential for long-term planning and cost forecasting.
📘 6. KPI Definition Sheet – Your Complete KPI Dictionary
This tab acts as the master reference for all KPIs used in the dashboard.
You can define:
-
KPI Name
-
KPI Group
-
Unit
-
Formula
-
Description
It’s perfect for training new team members and maintaining consistency across logistics departments.
📦 What’s Inside the Freight Cost KPI Dashboard in Google Sheets
The complete template includes:
-
Interactive Dashboard Page
-
KPI Trend Analysis Page
-
Actual Data Sheet
-
Monthly Target Sheet
-
Previous Year Data Sheet
-
KPI Definition Dictionary
-
Dropdown controls and auto-calculations
-
Conditional formatting & visual indicators
-
Fully cloud-based collaboration features
Everything is built, automated, and ready to use instantly.
🛠 How to Use the Freight Cost KPI Dashboard in Google Sheets
Using the dashboard is simple and does not require advanced technical skills.
- Step 1: Open the template and enable editing
- Step 2: Select month on the Dashboard (Cell D3)
- Step 3: Enter actual MTD and YTD numbers on the Actual Number Sheet
- Step 4: Update monthly targets on the Target Sheet
- Step 5: Review previous year data in the PY Sheet
- Step 6: Use the Dashboard to compare performance
- Step 7: Conduct monthly reviews using KPI Trend insights
- Within minutes, your freight performance becomes transparent, well-organized, and easy to understand.Freight Cost KPI Dashboard in Google Sheets
🎯 Who Can Benefit From This Freight Cost KPI Dashboard in Google Sheets
This dashboard is essential for:
-
Logistics Managers
-
Supply Chain Teams
-
Warehouse Operators
-
Freight Forwarding Companies
-
Transport Managers
-
Distribution Teams
-
Operations Directors
-
Business Owners
-
3PL & Carrier Management Teams
If you handle freight movement, this tool gives you the visibility and analytical power needed to stay cost-efficient.Freight Cost KPI Dashboard in Google Sheets












Reviews
There are no reviews yet.