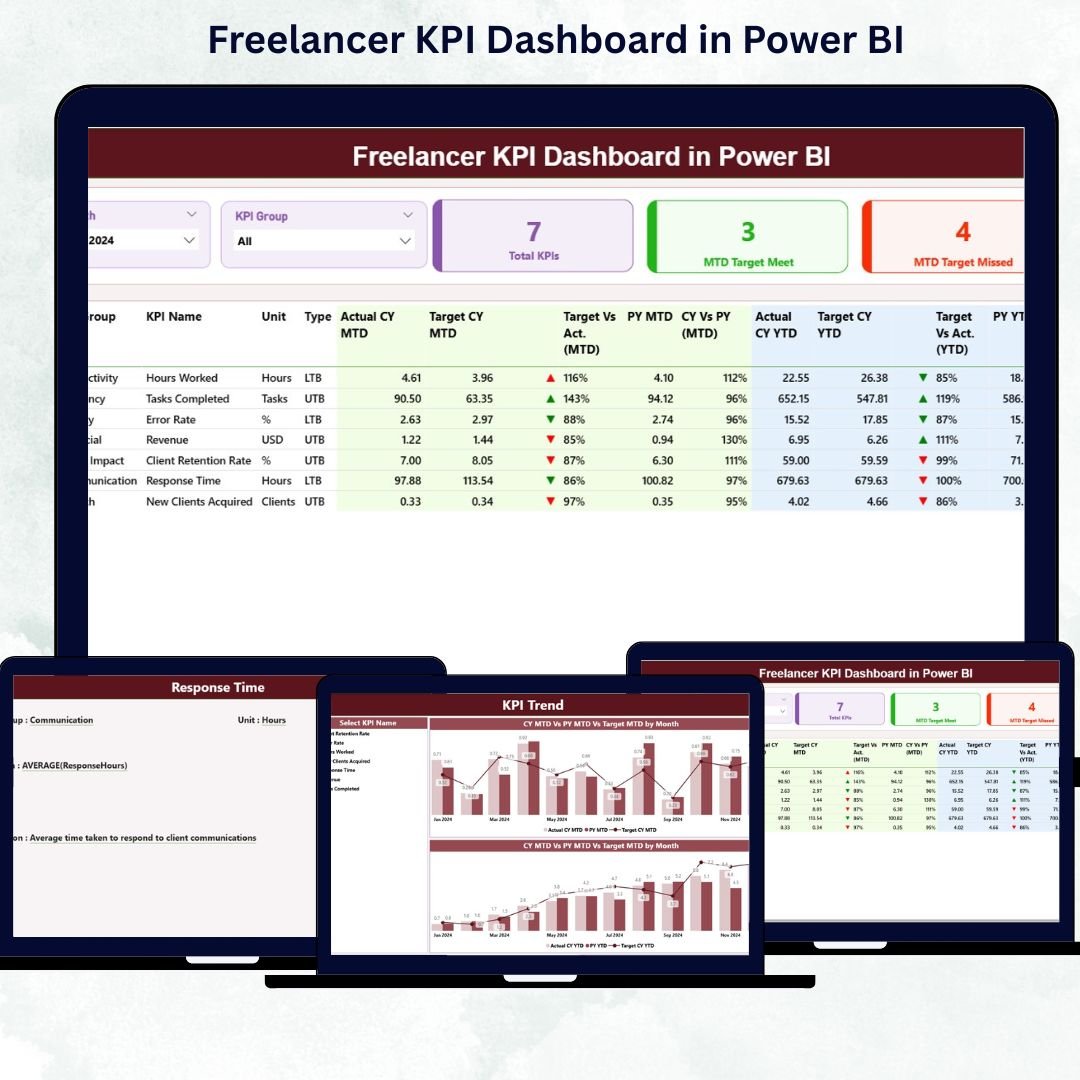
Managing multiple projects, clients, and deadlines as a freelancer can be overwhelming — especially when you rely only on spreadsheets. That’s why the Freelancer KPI Dashboard in Power BI is designed to simplify performance tracking and provide data-driven clarity for freelancers of all industries.
This ready-to-use dashboard helps you visualize your key metrics, monitor progress, and make smarter decisions — all within the powerful analytics environment of Microsoft Power BI. Whether you’re tracking income, billable hours, client satisfaction, or project efficiency, this tool gives you a complete business snapshot at a glance.
⚙️ Key Features of the Freelancer KPI Dashboard in Power BI
✅ 📊 Three Insightful Pages – Summary Page, KPI Trend Page, and KPI Definition Page — each offering a unique view of your freelance business performance.
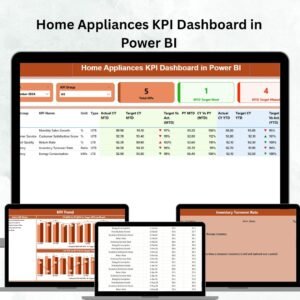
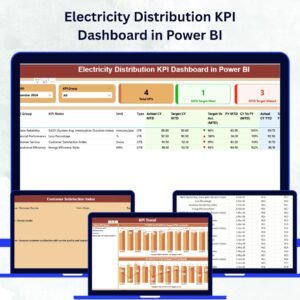
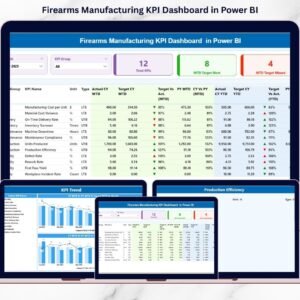
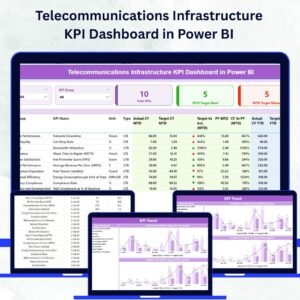
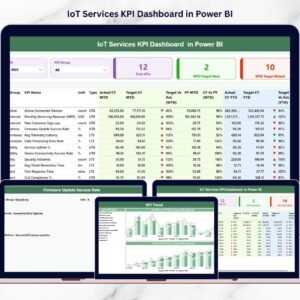
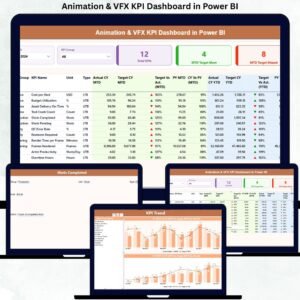
🧭 1. Summary Page – Your Central Command Hub
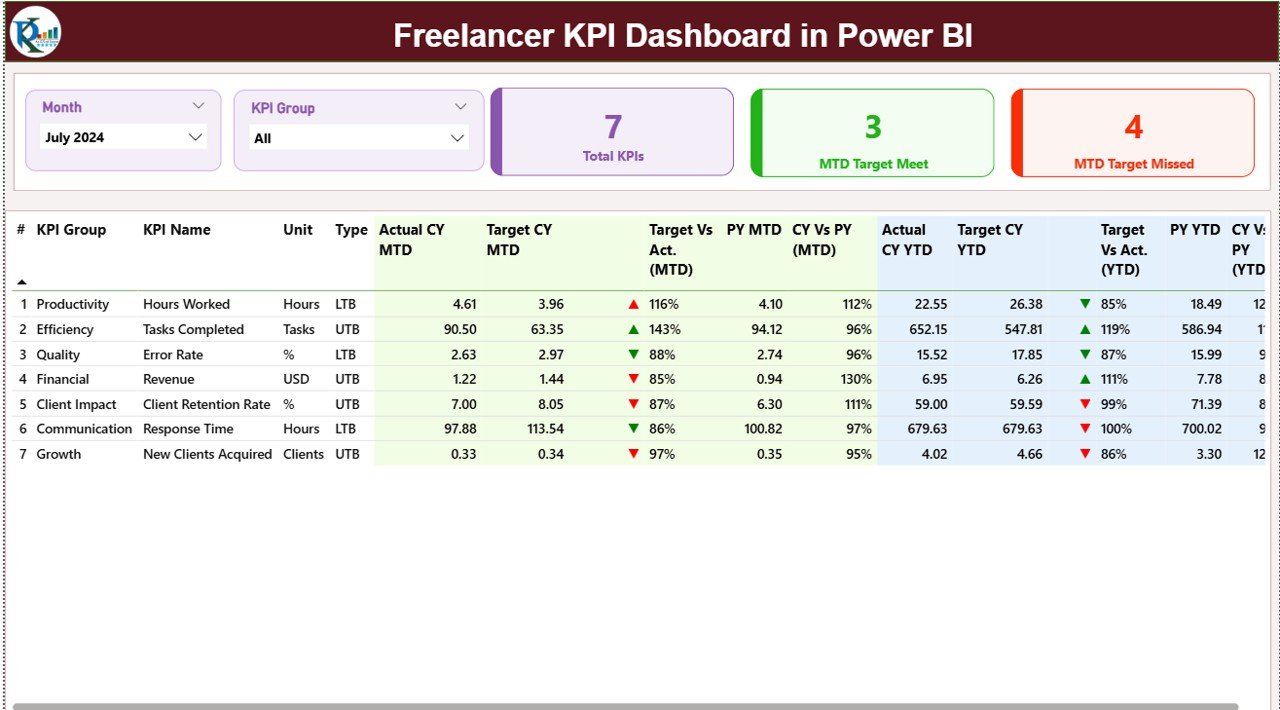
This page gives you an instant overview of all your KPIs.
-
📅 Month & KPI Group Slicers: Filter data by month or performance category.
-
📈 KPI Cards: Total KPIs, MTD Target Met, and MTD Target Missed indicators.
-
📊 Detailed Table: Displays actual vs. target performance, YTD analysis, and comparisons with previous year data.
-
🔼 Conditional Icons: Green arrows (▲) show KPIs on track, red arrows (▼) highlight areas needing attention.
👉 Instantly know which KPIs are improving, which need focus, and how your freelance performance evolves over time.
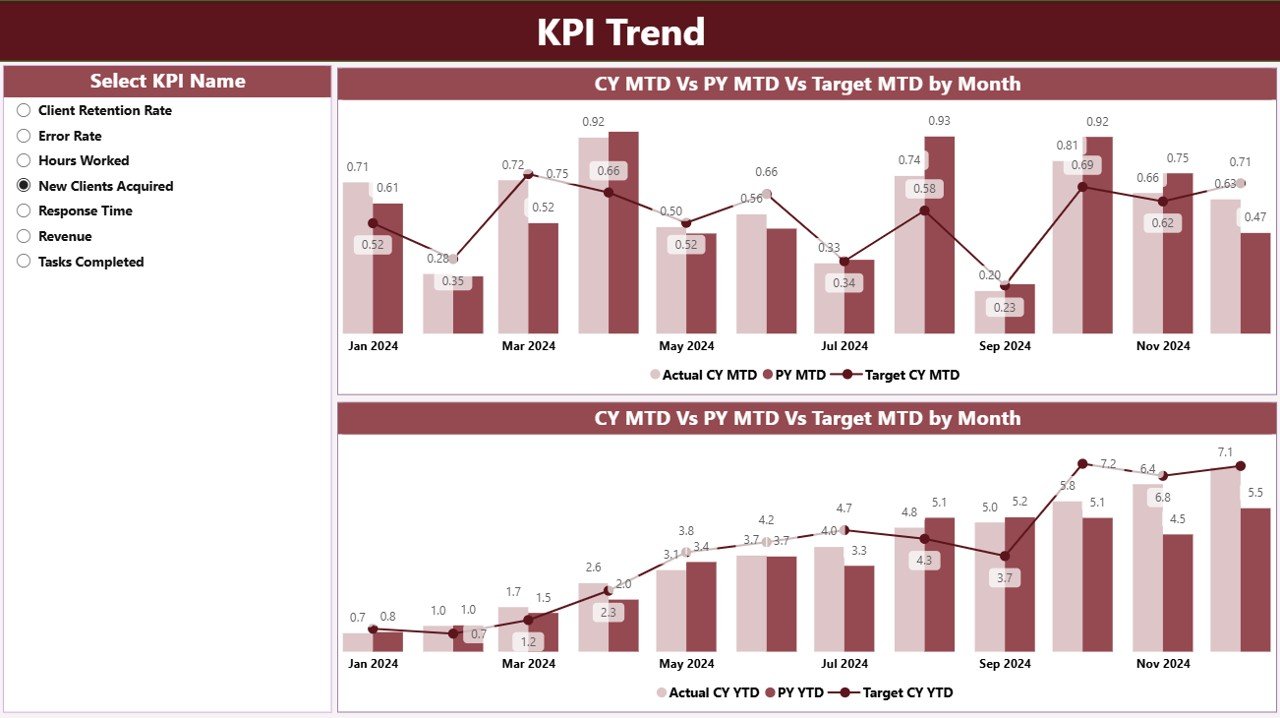
📈 2. KPI Trend Page – Visualize Performance Over Time
Gain a deeper understanding of trends and patterns with engaging visuals.
-
💡 Combo Charts: Compare Current Year Actuals, Targets, and Previous Year data for MTD and YTD.
-
🧩 KPI Selector: Choose any KPI to explore its month-by-month evolution.
-
🔍 Performance Insights: Identify peaks, dips, and areas to optimize — such as income consistency, client retention, or workload distribution.
Example: If your “Billable Hours Utilization” drops mid-year, you’ll spot it instantly and adjust accordingly.
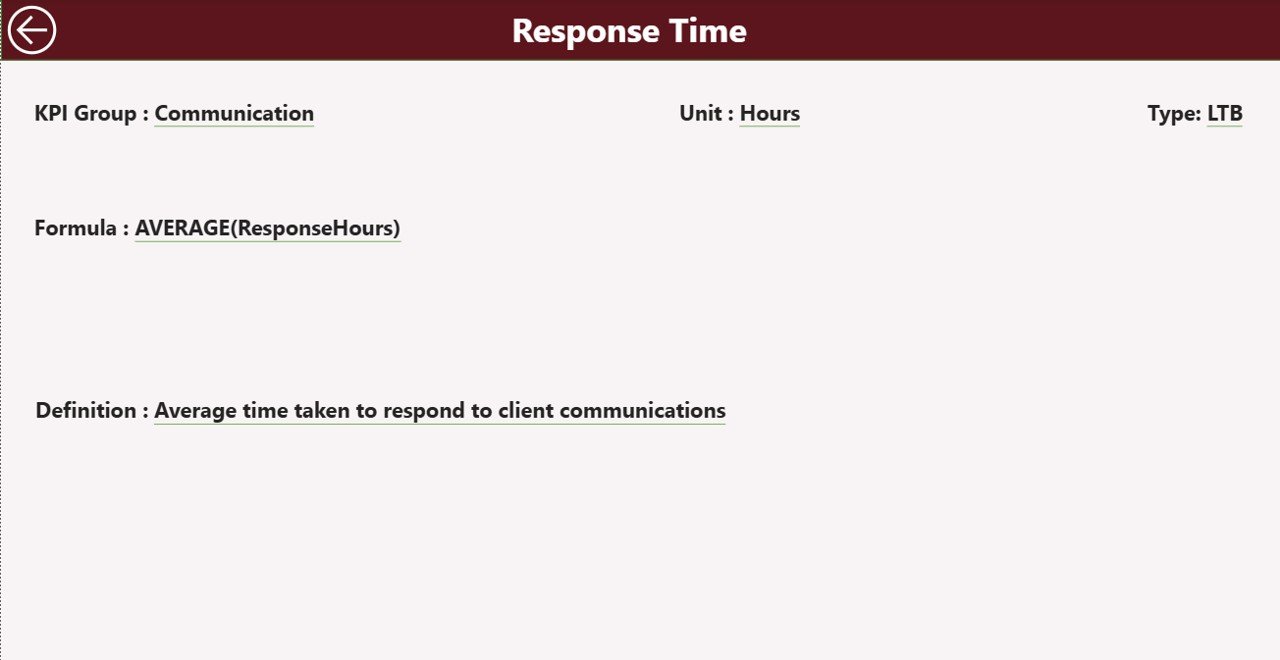
📚 3. KPI Definition Page – Understand Your Metrics Clearly
Transparency is key! This hidden drill-through page defines each KPI’s formula, meaning, and type.
-
📑 Fields Covered: KPI Number, KPI Name, Group, Unit, Formula, Definition, and Type (LTB/UTB).
-
🔁 Navigation: Easily return to the Summary Page via the back button.
This ensures every KPI is consistent, well-defined, and easy to interpret across projects.
🧩 What’s Inside the Freelancer KPI Dashboard in Power BI
📘 Excel Data Source:
The dashboard pulls information from three Excel sheets:
-
Input_Actual – Captures your real performance data.
-
Input_Target – Stores target metrics for each KPI.
-
KPI Definition – Provides reference data for formulas and definitions.
🧮 Dynamic Calculations: Automatically computes MTD/YTD performance, target variance, and year-over-year improvement.
🎨 Interactive Visuals: Modern design with slicers, charts, and conditional icons for easy storytelling.
💾 Editable Structure: You can add, remove, or edit KPIs to suit your freelance domain.
🚀 How to Use the Freelancer KPI Dashboard in Power BI
1️⃣ Update Excel Sheets: Add actual and target data each month.
2️⃣ Refresh Power BI: Click “Refresh” to load updated visuals instantly.
3️⃣ Filter Views: Use slicers to analyze by month, KPI group, or metric.
4️⃣ Interpret Icons: Green = met/exceeded targets; Red = below target.
5️⃣ Drill Through: Review KPI definitions for deeper clarity.
6️⃣ Share Reports: Export charts or PDFs for client presentations.
👨💼 Who Can Benefit from This Dashboard
🎯 Freelancers & Consultants – Monitor income, performance, and productivity.
💻 Designers & Developers – Track project turnaround time and client satisfaction.
📝 Writers & Marketers – Measure output, deadlines, and campaign efficiency.
📊 Financial & Business Analysts – Manage profitability and trend reporting.
This tool empowers every freelancer to operate like a professional agency — with clear metrics and measurable success.
🌟 Why Freelancers Love This Dashboard
✅ Real-Time Performance Tracking – No more guessing your business health.
✅ Financial Transparency – View monthly and yearly income targets easily.
✅ Data-Driven Decisions – Identify what’s working and where to improve.
✅ Professional Reporting – Impress clients with visual performance summaries.
✅ Customizable Design – Edit KPIs and visuals for your unique workflow.
🔗 Click here to read the Detailed blog post
📺 Visit our YouTube channel for step-by-step tutorials
👉 YouTube.com/@PKAnExcelExpert


Reviews
There are no reviews yet.