


Managing forex operations without clear performance visibility is risky, time-consuming, and inefficient. Many forex service providers still depend on disconnected Excel files, manual calculations, and delayed reports. As a result, critical insights arrive late, and decision-making becomes reactive instead of proactive.
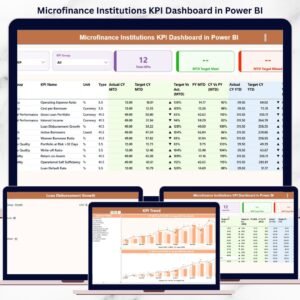
The Forex Services KPI Dashboard in Power BI is a ready-to-use analytics solution designed to solve these challenges. It converts raw forex operational data into powerful, interactive insights that help you monitor performance, track targets, and compare results across time—all from one centralized dashboard.
This professionally designed dashboard helps forex brokers, currency exchange firms, and financial service providers stay in control, reduce reporting effort, and make faster, data-driven decisions.
🚀 Key Features of Forex Services KPI Dashboard in Power BI
📊 Centralized KPI Monitoring
Track all forex-related KPIs in one interactive Power BI dashboard instead of managing multiple spreadsheets.
🎯 MTD, YTD & Target Tracking
Monitor Month-to-Date, Year-to-Date, target values, and previous-year comparisons with automatic calculations.
📈 Smart KPI Status Indicators
Visual arrows and color indicators instantly show whether KPIs are performing above or below targets.
🔍 Interactive Slicers & Filters
Use Month and KPI Group slicers to analyze performance dynamically without technical effort.
📉 Trend Analysis with Combo Charts
Compare current year actuals, targets, and previous year values to identify growth patterns and risks.
🧠 UTB & LTB KPI Logic Built-In
Automatically handles Upper-the-Better and Lower-the-Better KPIs for accurate performance interpretation.
🔗 Drill-Through KPI Definitions
Click on any KPI to view its formula, definition, and logic—no external documentation required.
⚡ Excel-Based Data Source
Simply update Excel and refresh Power BI—no coding or complex integrations needed.

📦 What’s Inside the Forex Services KPI Dashboard in Power BI
📁 Power BI Desktop (.pbix) File
Pre-built dashboard with Summary, KPI Trend, and KPI Definition pages.
📄 Excel Data File Structure
Includes structured sheets for:
-
Input_Actual
-
Input_Target
-
KPI Definition
📊 Summary Page
-
KPI Group slicer
-
Month slicer
-
KPI performance cards
-
Detailed KPI performance table
📈 KPI Trend Page
-
MTD trend comparison
-
YTD trend comparison
-
Combo charts for CY, PY, and targets
📘 KPI Definition Page
-
Hidden drill-through page
-
KPI formula, unit, and explanation
This structure ensures clarity, consistency, and governance across your forex KPIs.
🛠 How to Use the Forex Services KPI Dashboard in Power BI
1️⃣ Enter actual KPI values in the Input_Actual Excel sheet
2️⃣ Enter target values in the Input_Target sheet
3️⃣ Maintain KPI logic in the KPI Definition sheet
4️⃣ Open the Power BI file
5️⃣ Refresh data
6️⃣ Use slicers, charts, and drill-through features to analyze performance
Because of this simple workflow, even non-technical users can maintain and use the dashboard confidently.
👥 Who Can Benefit from This Forex Services KPI Dashboard
💼 Forex Brokers & Trading Firms – Track operational performance and profitability
🏦 Currency Exchange Businesses – Monitor targets and historical trends
📊 Finance & Operations Managers – Improve reporting speed and accuracy
⚠ Risk & Compliance Teams – Identify underperforming KPIs early
📈 Business Owners & Leaders – Make informed, data-driven decisions
This dashboard supports both strategic planning and daily operational monitoring.
Click here to read the Detailed Blog Post
Watch the step-by-step video tutorial:


Reviews
There are no reviews yet.