
Still managing your fleet using scattered spreadsheets and outdated reports? That approach increases fuel waste, maintenance overruns, and unexpected vehicle downtime. 🚛💸 If you want complete control over your fleet operations, you need real-time visibility and structured analytics.
The Fleet Management Dashboard in Power BI is a powerful, interactive reporting solution designed to transform raw fleet data into clear, actionable insights. Instead of guessing where costs are rising, you instantly track fuel expenses, maintenance budgets, active vehicles, and downtime trends — all in one centralized dashboard.
Built inside Microsoft Power BI, this ready-to-use dashboard empowers fleet managers, logistics heads, and operations leaders to make faster, smarter, data-driven decisions. Whether you manage delivery vans, trucks, construction vehicles, or corporate fleets, this dashboard gives you complete operational transparency.
If reducing costs, improving utilization, and increasing efficiency matter to you — this dashboard is your competitive advantage. 🚀
Key Feature of Fleet Management Dashboard in Power BI
📊 5 Interactive Dashboard Pages – Overview, Vehicle Analysis, Fuel Analysis, Region Analysis, and Monthly Trends.
📌 Powerful KPI Cards – Instantly monitor Total Vehicles, Fuel Cost, Maintenance Cost, Average Downtime (Days), and Active Vehicles.
⛽ Fuel Cost Breakdown – Analyze fuel cost by fuel type and track fuel consumption efficiency.
🔧 Maintenance Performance Tracking – Identify cost-intensive vehicle types and monitor vehicles under maintenance.
🌍 Regional Performance Insights – Compare downtime, fuel usage, and maintenance cost across regions.
📈 Monthly Trend Analysis – Detect seasonal spikes in fuel cost, downtime, and maintenance expenses.
🚦 Active Vehicle % Monitoring – Measure fleet utilization and asset productivity.
⚡ Real-Time Interactive Visuals – Filter data instantly and explore performance dynamically.
🎯 Customizable KPIs – Modify measures and filters according to your business model.
What’s Inside the Fleet Management Dashboard in Power BI
This dashboard includes 5 professionally structured pages inside Power BI Desktop:
1️⃣ Overview Page – Complete Fleet Snapshot
The central control panel displaying:
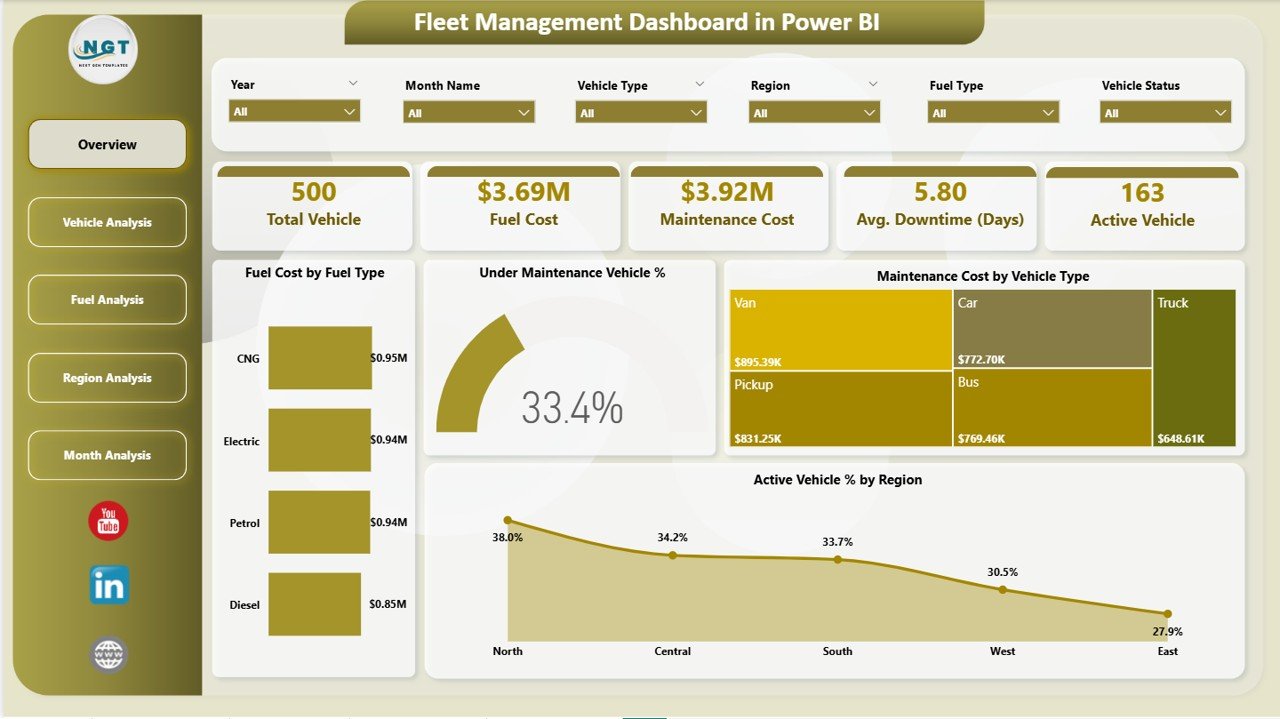
KPI Cards:
-
Total Vehicles
-
Fuel Cost
-
Maintenance Cost
-
Average Downtime (Days)
-
Active Vehicles
Charts Included:
-
Fuel Cost by Fuel Type
-
Under Maintenance Vehicle %
-
Maintenance Cost by Vehicle Type
-
Active Vehicle % by Region
This page delivers instant clarity on fleet health.
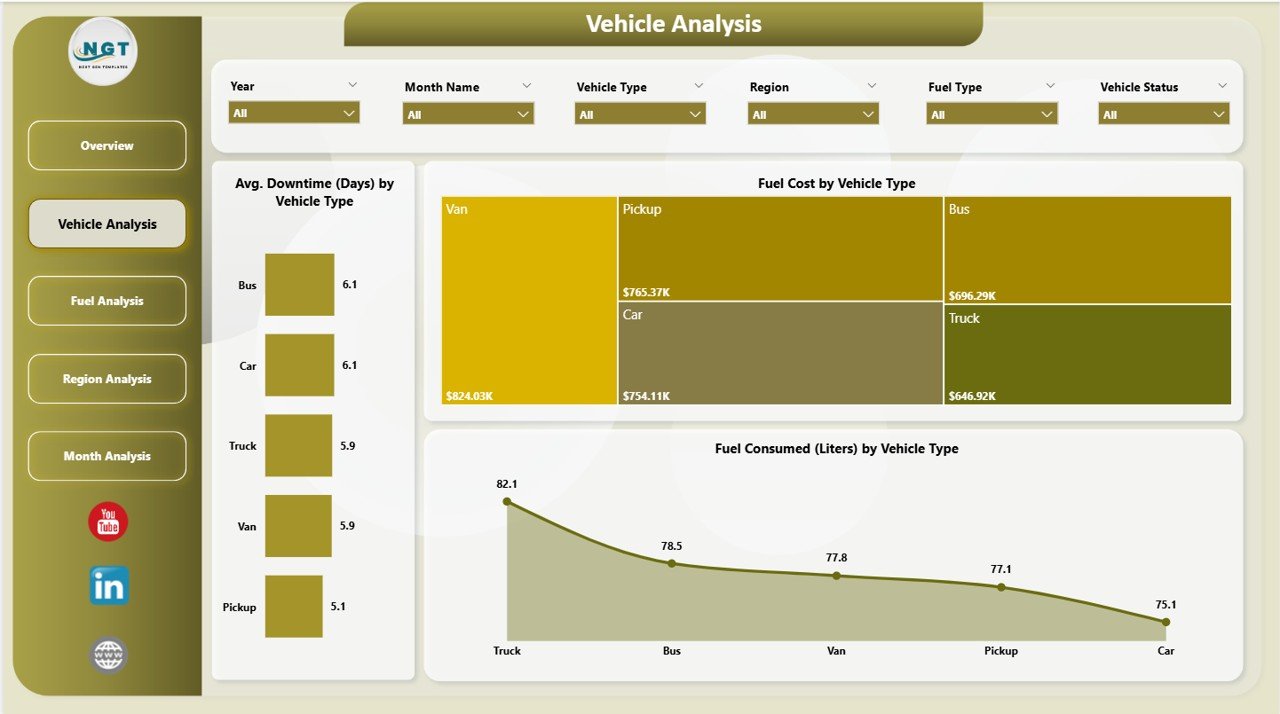
2️⃣ Vehicle Analysis Page
Focused insights by vehicle type:
-
Average Downtime (Days) by Vehicle Type
-
Fuel Cost by Vehicle Type
-
Fuel Consumed (Liters) by Vehicle Type
Identify high-cost and low-efficiency vehicles easily.
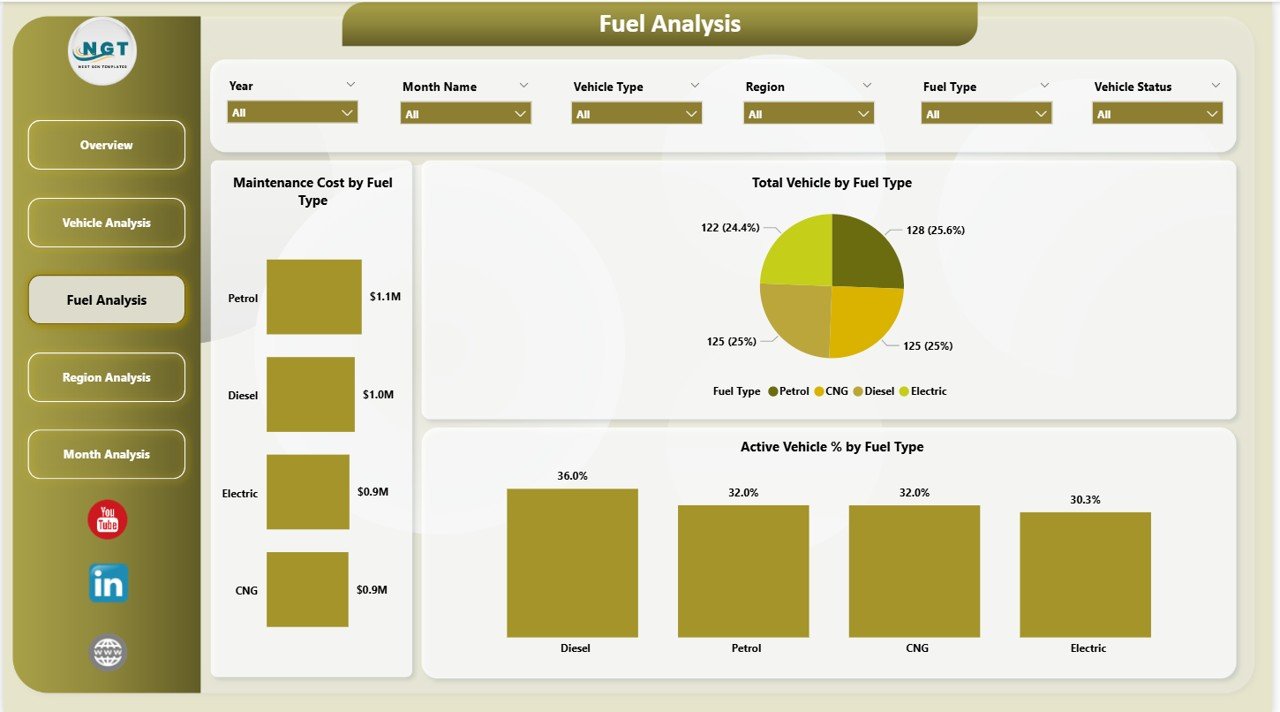
3️⃣ Fuel Analysis Page
Dedicated fuel performance analytics:
-
Maintenance Cost by Fuel Type
-
Total Vehicles by Fuel Type
-
Active Vehicle % by Fuel Type
Compare diesel, petrol, electric, or hybrid performance instantly.
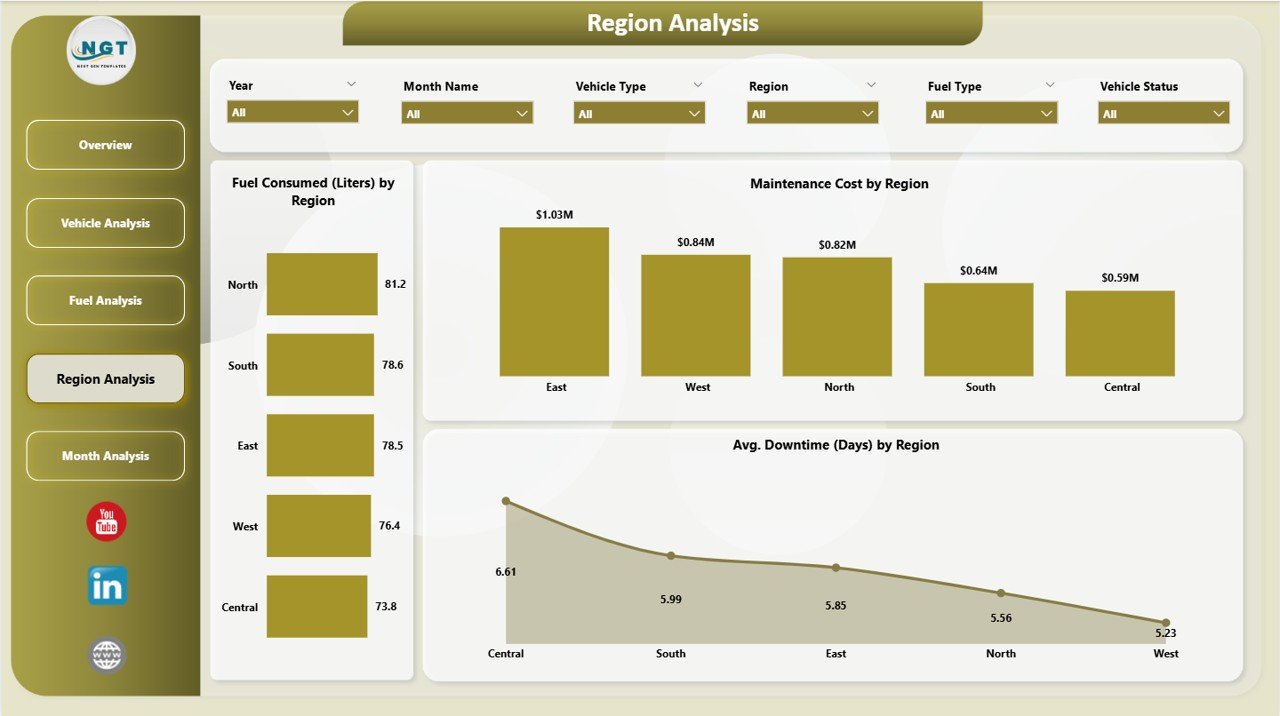
4️⃣ Region Analysis Page
Geographic fleet performance tracking:
-
Fuel Consumed (Liters) by region
-
Maintenance Cost by Region
-
Average Downtime (Days) by region
Pinpoint underperforming branches quickly.
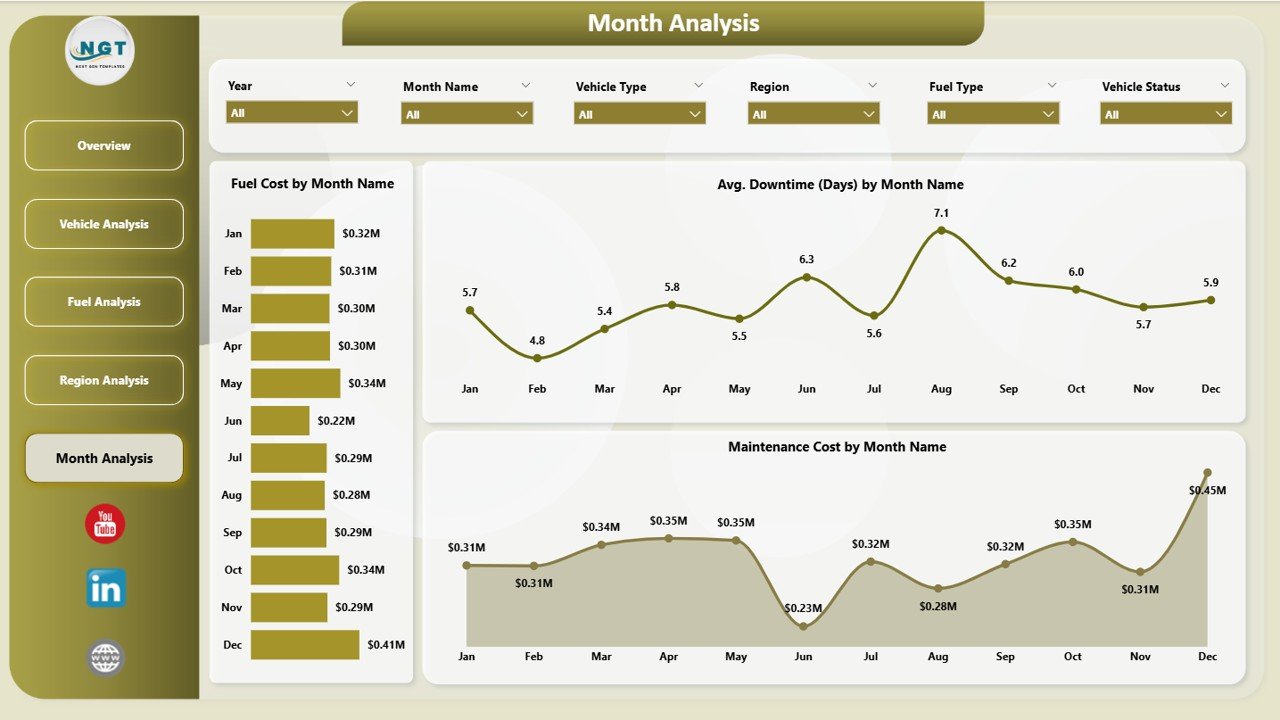
5️⃣ Monthly Trends Page
Time-based analysis including:
-
Fuel Cost by Month
-
Average Downtime by Month
-
Maintenance Cost by Month
Perfect for long-term planning and forecasting.
How to Use the Fleet Management Dashboard in Power BI
Using this dashboard is simple:
1️⃣ Import your fleet data into Power BI.
2️⃣ Refresh the dataset regularly.
3️⃣ Use filters to analyze specific regions or vehicle types.
4️⃣ Monitor KPI cards for instant performance signals.
5️⃣ Review Monthly Trends for seasonal insights.
6️⃣ Share reports with management during review meetings.
For best results:
-
Update fuel and maintenance data consistently.
-
Monitor downtime weekly.
-
Set cost benchmarks for performance evaluation.
-
Focus on preventive maintenance to reduce breakdowns.
Within weeks, you’ll notice improved control and smarter fleet decisions.
Who Can Benefit from This Fleet Management Dashboard in Power BI
This dashboard is ideal for:
🚚 Logistics Companies
📦 Delivery & Transportation Providers
🏗 Construction Businesses
⚡ Utility Service Providers
🏢 Corporate Fleet Managers
🚛 Distribution & Supply Chain Teams
Any organization managing vehicles can use this dashboard to reduce costs and improve efficiency.
If your fleet impacts your revenue — this dashboard becomes essential.
Click here to read the Detailed blog post
Visit our YouTube channel to learn step-by-step video tutorials
👉 Youtube.com/@PKAnExcelExpert


