Every organization faces financial risks—whether it’s credit exposure, liquidity pressure, operational errors, or market fluctuations. When risk is not tracked properly, businesses make slow decisions, overlook warning signs, and suffer unnecessary financial losses. Manual reporting often leads to inconsistent data, slow updates, and unclear risk visibility. To solve these challenges, companies rely on smarter tools like the Financial Risk KPI Dashboard in Google Sheets—a structured, automated, and real-time risk monitoring system.
This dashboard brings all your Key Risk Indicators (KRIs) into one place, converts raw data into meaningful insights, and updates instantly when you select a month. Whether you manage credit risk, liquidity risk, operational risk, or financial exposure, this dashboard helps you measure performance, identify trends, and detect early warnings effortlessly. Since it runs in Google Sheets, teams enjoy cloud access, real-time collaboration, and zero software installation.
✨ Key Features of the Financial Risk KPI Dashboard in Google Sheets
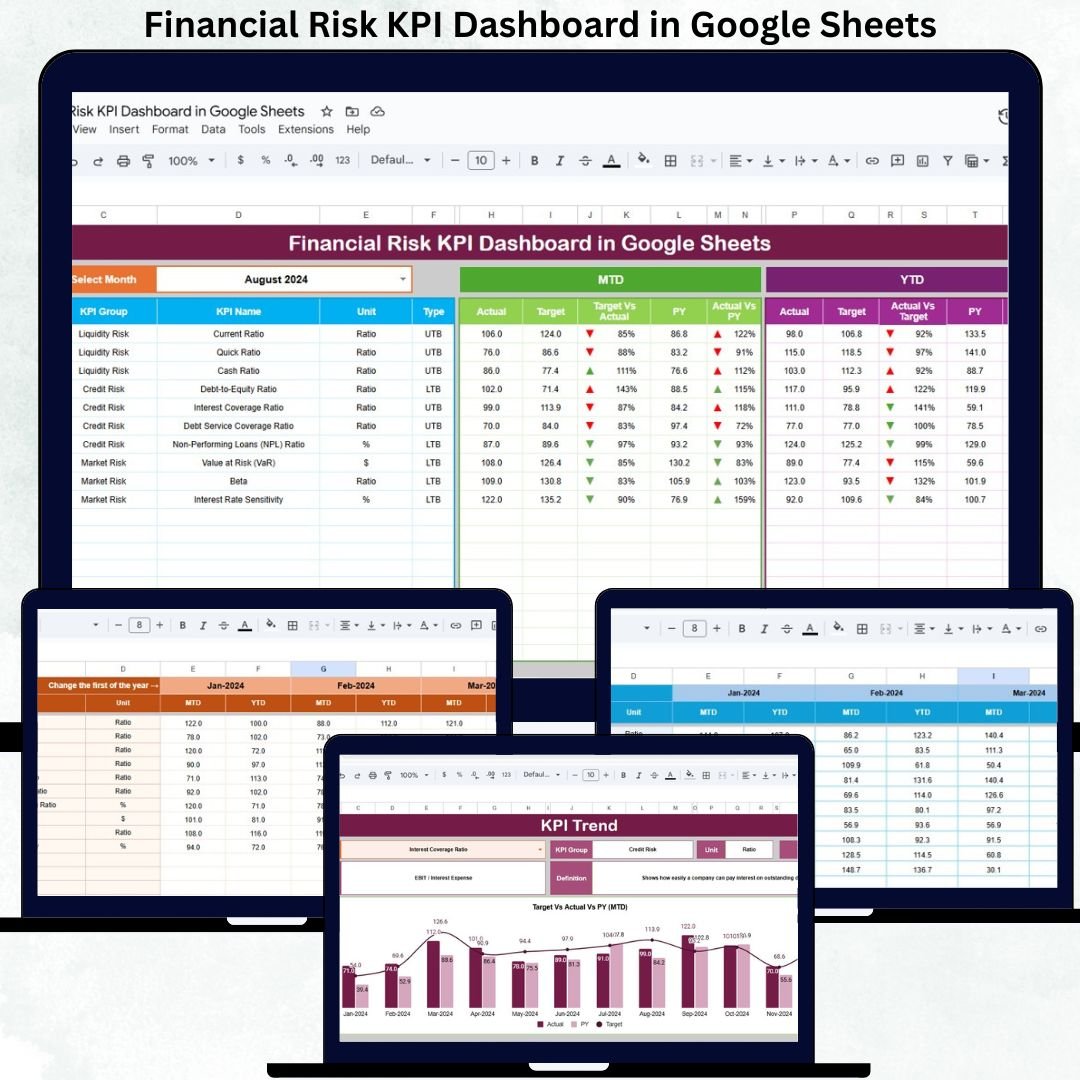
📊 1. Real-Time MTD & YTD Risk Monitoring
Monitor Month-to-Date and Year-to-Date Actual vs Target vs Previous Year performance instantly. The dashboard updates automatically when the user selects a month from cell D3. This provides a clear, accurate, and fast overview of risk movements.
📉 2. Automatic Variance Indicators
Conditional formatting arrows show whether risk performance is improving or worsening. Green arrows indicate improvement, while red arrows highlight areas needing quick attention—helping leaders make informed decisions faster.
📘 3. Structured Worksheets for Clean Reporting
Six well-organized sheets ensure accuracy: Dashboard, KPI Trend, Actuals, Targets, Previous Year, and KPI Definitions. Each sheet plays a crucial role in delivering a complete risk view.
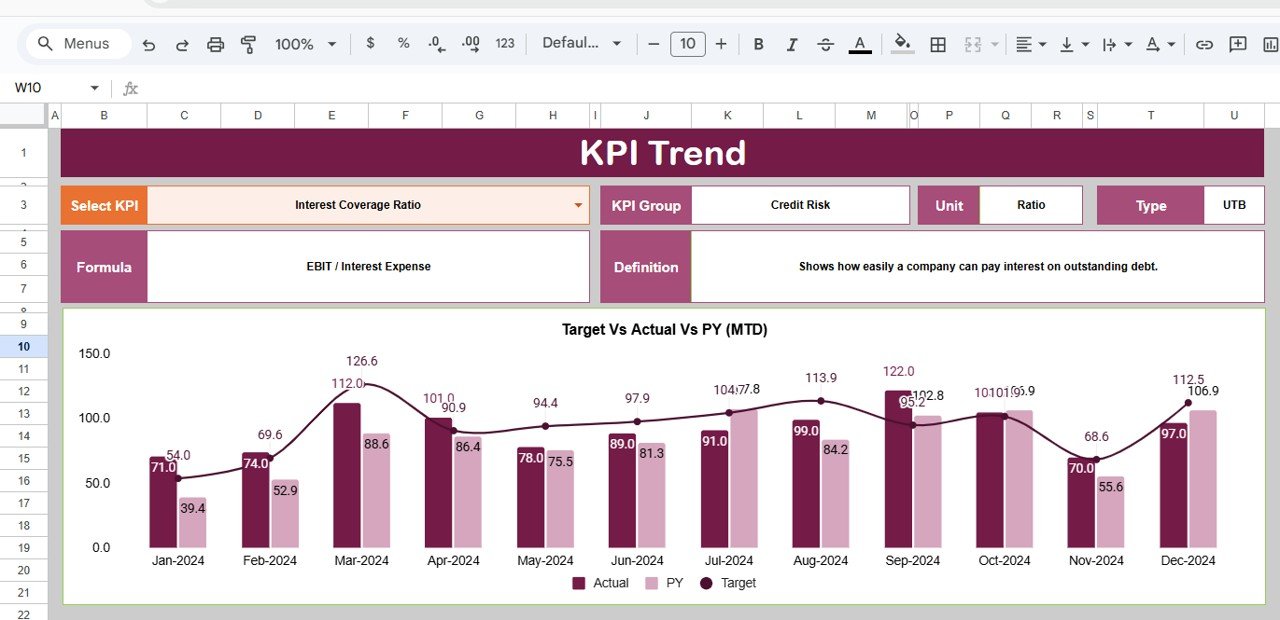
📈 4. Detailed KPI Trend Analysis
Drill down into any risk KPI by selecting it in cell C3. View its unit, group, formula, definition, and KPI type (UTB or LTB). The trend page helps analysts understand how each risk metric behaves over time.
⚡ 5. Fully Automated Month Selection
Switch months with one click—no need to adjust formulas manually. The dashboard recalculates values and refreshes visuals instantly.
📦 What’s Inside the Financial Risk KPI Dashboard in Google Sheets
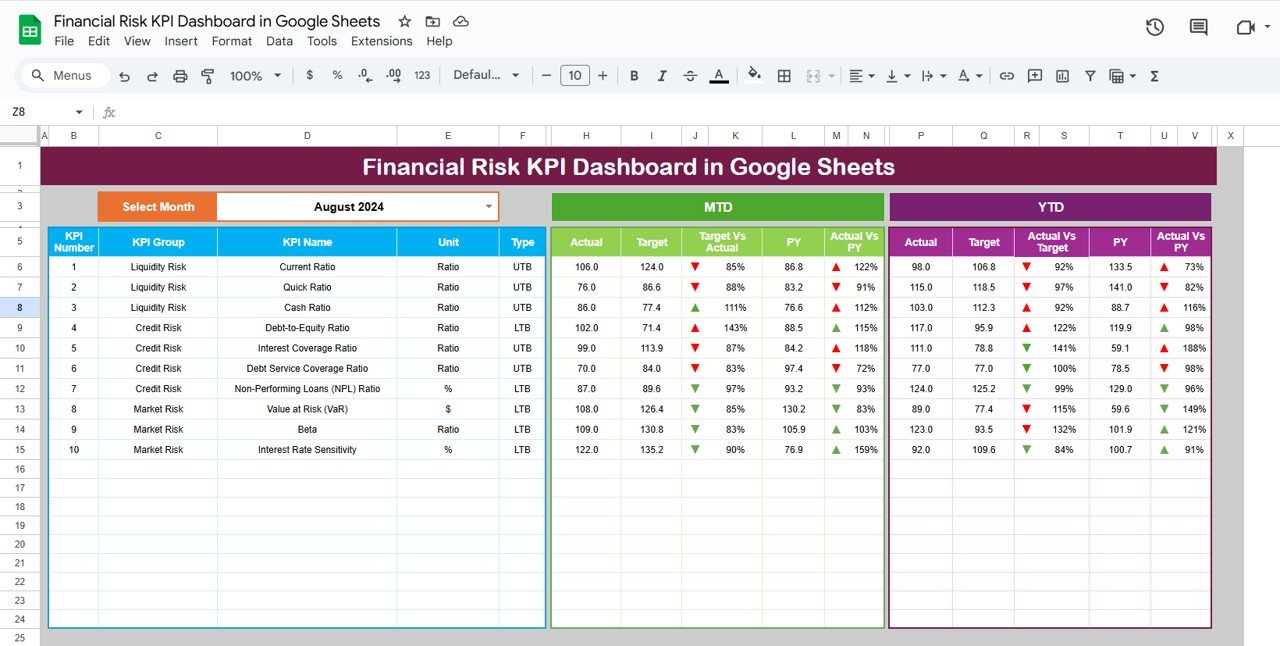
🖥️ Dashboard Sheet Tab (Main Insights Page)
This is the command center for risk monitoring. It displays:
-
MTD Actual vs Target vs Previous Year
-
YTD Actual vs Target vs Previous Year
-
Risk variance indicators
-
Clean and structured KPI cards
Senior management can evaluate risk exposure and performance with just one glance.
📈 KPI Trend Sheet Tab
Choose any KPI to view:
-
KPI Group (Liquidity, Credit, Market, Operational, etc.)
-
Unit of Measurement
-
KPI Type (UTB or LTB)
-
Formula used
-
Clear definition
This sheet helps in stakeholder reporting, audits, and analytical discussions.
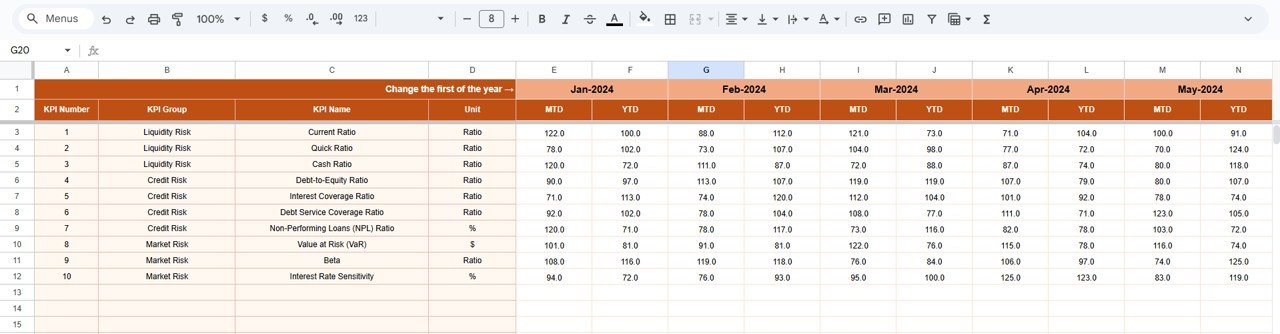
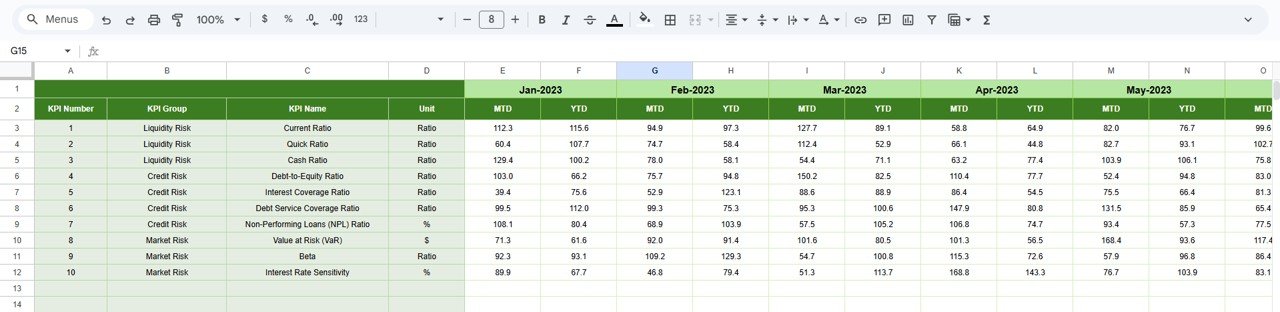
📋 Actual Numbers Sheet Tab
Enter MTD and YTD actual values here. Select the current month using cell E1 to ensure the dashboard reflects accurate real-time data.
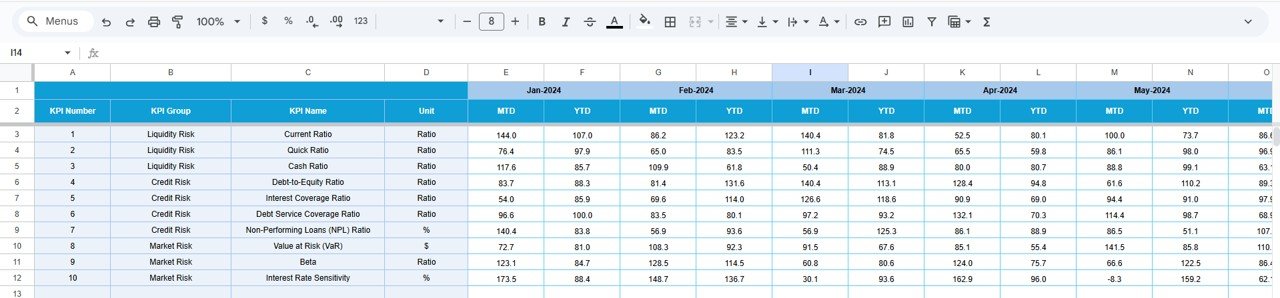
🎯 Target Sheet Tab
Enter MTD and YTD targets for each KPI. The dashboard compares actual vs target to show whether your risk levels are within acceptable thresholds.
📆 Previous Year Numbers Sheet Tab
Add last year’s data to compare trends and risk movements. YOY analysis strengthens forecasting and highlights long-term patterns.
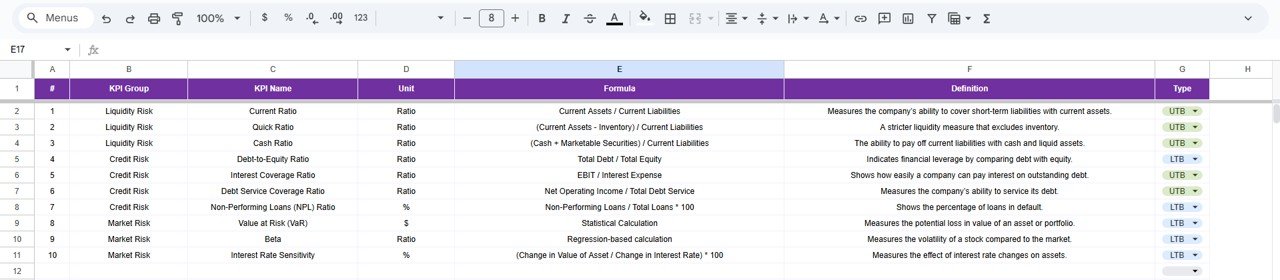
📘 KPI Definition Sheet Tab
Contains KPI names, units, formulas, definitions, and types. This ensures standardization across the team and avoids confusion.
🛠️ How to Use the Financial Risk KPI Dashboard in Google Sheets
1️⃣ Update Actual Numbers Monthly
Keeping fresh data ensures accurate MTD and YTD insights.
2️⃣ Add or Review Targets
Targets help identify deviations early and improve planning.
3️⃣ Compare Actuals with Previous Year
Understanding trends helps prevent recurring issues.
4️⃣ Review KPI Trends Regularly
Spot early risk warnings and adjust strategies immediately.
5️⃣ Use Month Dropdown to Refresh the Dashboard
Save time with automated updates and clear visuals.
6️⃣ Maintain KPI Definitions
Ensure consistency in calculations and team understanding.
🎯 Who Can Benefit from This Financial Risk KPI Dashboard in Google Sheets
📊 Finance Teams & Analysts
Track KRIs, detect deviations, and support risk reviews.
💼 CFOs & Senior Management
Get real-time insights for strategic decision-making.
📋 Auditors & Compliance Teams
Use structured data and clear documentation for audits.
🏢 Corporates & SMEs
Improve governance, financial visibility, and risk readiness.
🎯 Risk Managers
Analyze trends and maintain accountability across departments.


Reviews
There are no reviews yet.