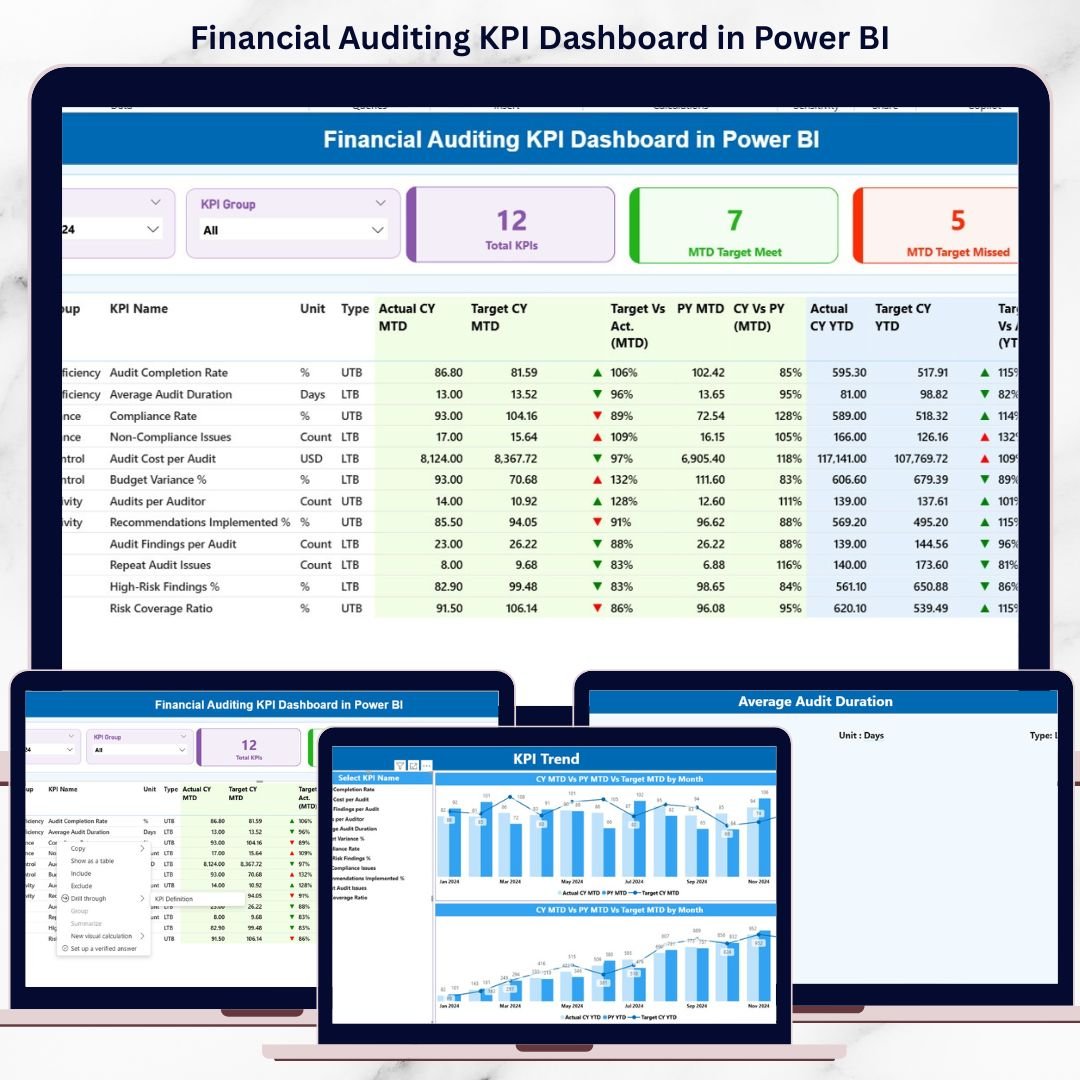
Financial audits demand accuracy, transparency, and speed. However, many audit teams still struggle with scattered Excel files, manual calculations, and time-consuming reports. As a result, insights get delayed and audit performance becomes difficult to explain. That is exactly where the Financial Auditing KPI Dashboard in Power BI becomes a game-changing solution.
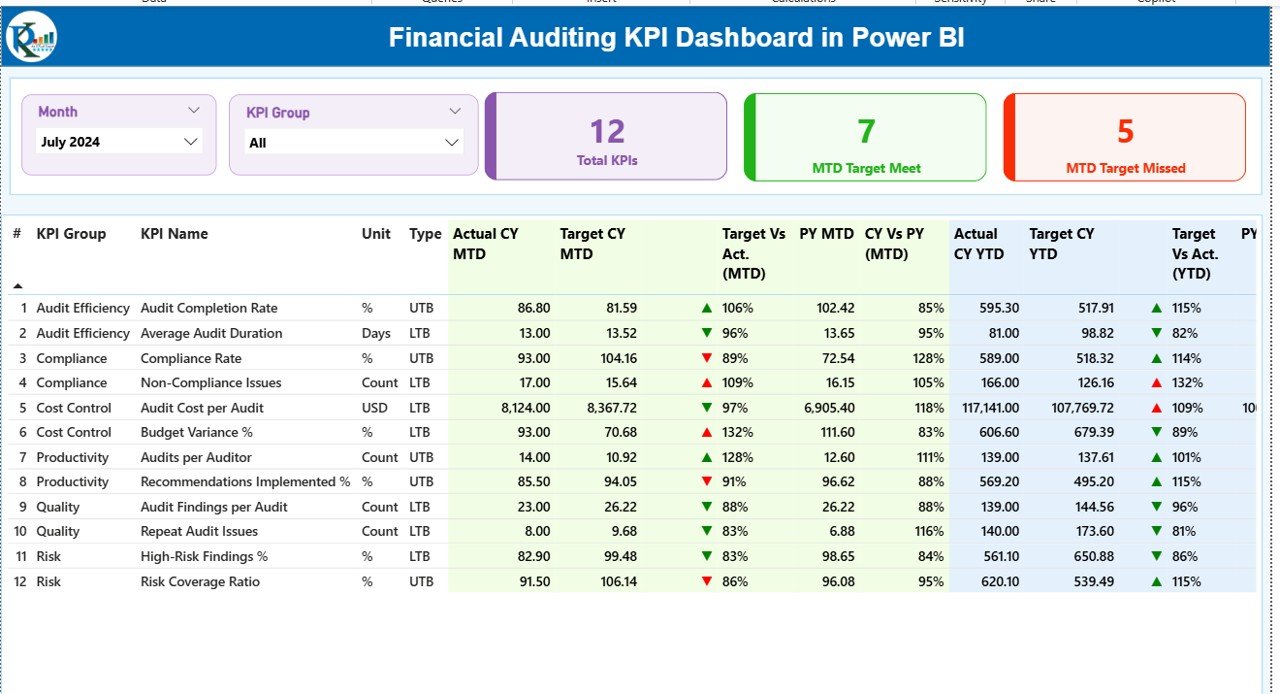
This ready-to-use Power BI dashboard transforms raw financial audit data into clear KPIs, interactive visuals, and actionable insights. Instead of reviewing lengthy audit reports, auditors can instantly track MTD and YTD performance, target vs actual results, and year-over-year trends from a single dashboard. Consequently, audit teams save time, improve accuracy, and build stronger confidence with stakeholders.
Designed for simplicity and performance, this dashboard connects seamlessly with an Excel data source. You only update the Excel file, refresh Power BI, and all visuals update automatically. Therefore, you get a powerful audit analytics solution without complex integrations or advanced Power BI skills.
🚀 Key Features of Financial Auditing KPI Dashboard in Power BI
✅ Centralized Audit KPI Monitoring
Track all financial auditing KPIs in one interactive dashboard instead of managing multiple reports.
📅 MTD & YTD Performance Analysis
Analyze Month-to-Date and Year-to-Date audit results side by side for better control and planning.
🎯 Target vs Actual Comparison
Instantly identify whether audit KPIs are meeting or missing targets using icons and percentages.
📈 Year-over-Year Trend Analysis
Compare current year performance with previous year values to spot recurring issues and improvements.
🧭 Interactive Slicers
Filter data easily by Month and KPI Group to focus on specific audit areas.
📊 Professional Audit Visuals
Clean tables, KPI cards, and combo charts designed for management and regulatory reporting.
📦 What’s Inside the Financial Auditing KPI Dashboard in Power BI
This product includes a fully structured Power BI file connected to an Excel-based data model:
📄 Excel Data Source (3 Sheets)
-
Input_Actual – Enter MTD & YTD actual audit values
-
Input_Target – Maintain MTD & YTD target values
-
KPI Definition – KPI number, group, unit, formula, definition, and type (LTB/UTB)
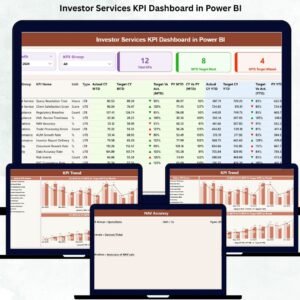
📊 Power BI Dashboard (3 Pages)
-
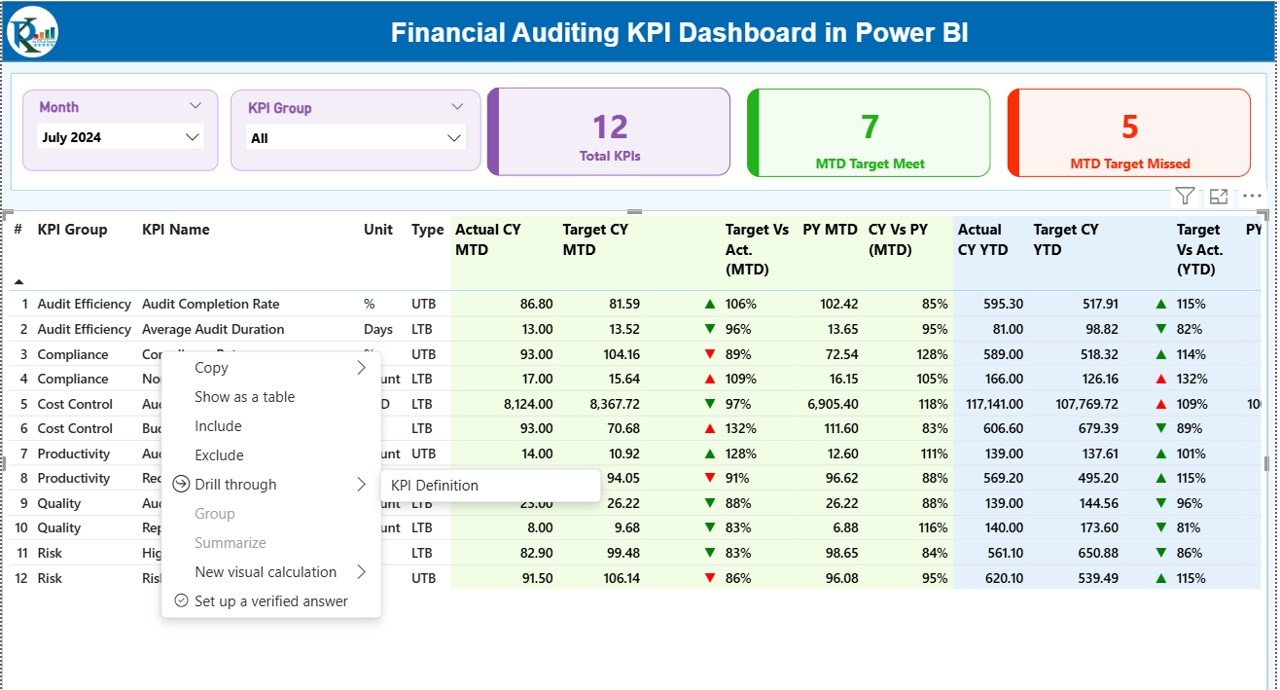
Summary Page – KPI cards, slicers, and detailed audit KPI table
-
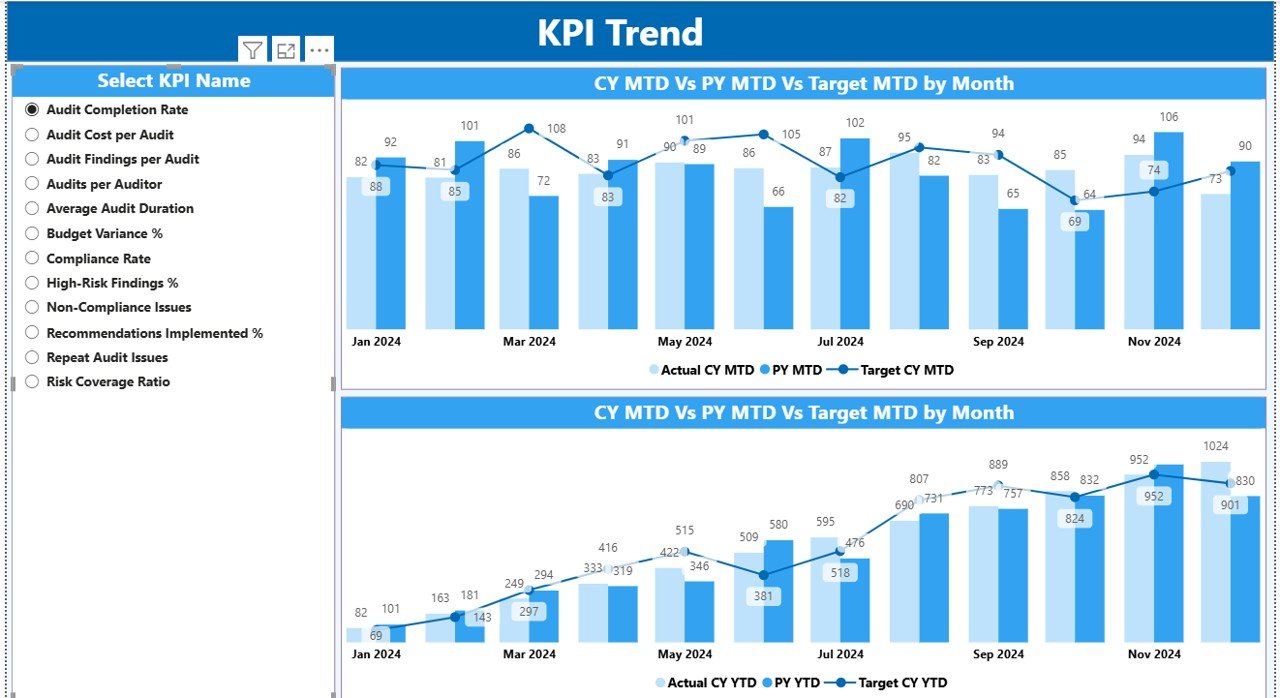
KPI Trend Page – MTD & YTD combo charts with KPI selector
-
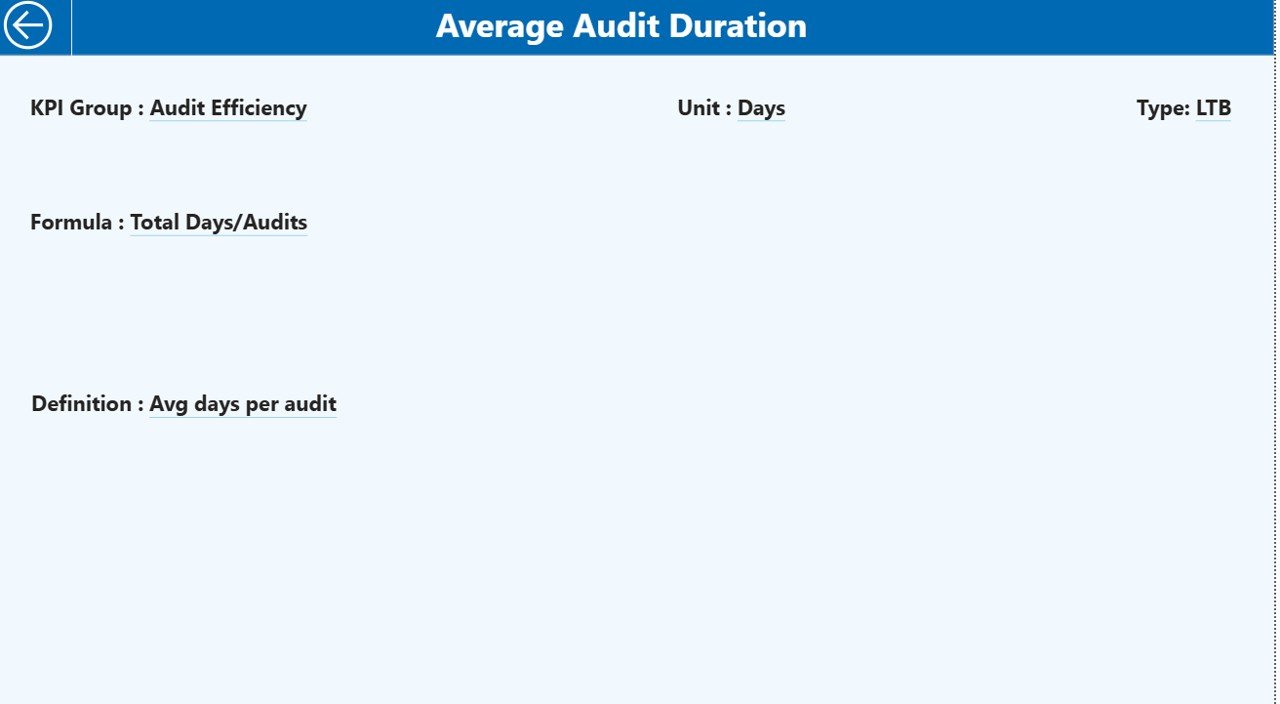
KPI Definition Page – Drill-through page for KPI explanation and formulas
Because of this structure, all calculations and visuals update automatically.
🛠️ How to Use the Financial Auditing KPI Dashboard in Power BI
Using this dashboard is simple and user-friendly:
1️⃣ Update actual audit data in the Input_Actual Excel sheet
2️⃣ Enter or revise targets in the Input_Target sheet
3️⃣ Maintain KPI logic in the KPI Definition sheet
4️⃣ Open the Power BI file and click Refresh
5️⃣ Use slicers to analyze KPIs by month and category
6️⃣ Drill through to KPI definitions whenever required
As a result, audit analysis becomes faster, clearer, and more reliable.
👥 Who Can Benefit from This Financial Auditing KPI Dashboard in Power BI
This dashboard is ideal for:
✔ Internal Audit Teams – Monitor audit performance and findings efficiently
✔ External Audit Firms – Present audit insights professionally to clients
✔ Compliance Officers – Track compliance-related KPIs with clarity
✔ CFOs & Finance Managers – Gain visibility into audit effectiveness
✔ Risk Management Teams – Identify risks and trends early
Whether you are a small audit team or a large enterprise, this dashboard adapts to your needs.
Click here to read the Detailed blog post
Watch the step-by-step video tutorial:


Reviews
There are no reviews yet.