In today’s fast-changing business environment, organizations must maintain strong financial governance, ensure regulatory compliance, and manage operational risks effectively. However, many audit teams still rely on static spreadsheets, manual reports, and disconnected systems. As a result, tracking audit progress, monitoring risks, and evaluating compliance performance becomes slow and inefficient.
The Financial Auditing Dashboard in Power BI is a powerful, ready-to-use analytics solution designed to modernize audit monitoring through interactive visualization and real-time insights. This dashboard transforms complex audit data into clear, actionable intelligence, allowing organizations to improve transparency, strengthen governance, and accelerate decision-making.
Instead of reviewing multiple audit reports separately, managers and executives can analyze all audit KPIs from one centralized platform. Built using Microsoft Power BI, the dashboard automatically updates visuals whenever data refreshes, ensuring teams always work with accurate and current information.
Whether you want to monitor audit progress, identify high-risk findings, compare departmental compliance, or track performance trends over time, this dashboard provides a complete audit management view in one place.
📊 Key Feature of Financial Auditing Dashboard in Power BI
🔎 Centralized Audit Monitoring
Track audit activities, findings, risks, and compliance performance from one unified dashboard.
📈 Interactive KPI Cards
Instantly evaluate audit health using summarized performance indicators.
🎛️ Dynamic Filters & Slicers
Analyze audits by department, region, audit type, or time period.
⚠️ Risk Identification Visualization
Highlight high-risk findings quickly for faster corrective actions.
📅 Trend Monitoring Over Time
Track audit performance monthly to identify improvement patterns.
🌍 Multi-Department & Regional Analysis
Compare compliance performance across organizational units.
⚡ Real-Time Data Updates
Refresh datasets and instantly view updated insights.
📊 Executive-Ready Reporting
Professional visuals suitable for leadership and stakeholder presentations.
📦 What’s Inside the Financial Auditing Dashboard in Power BI
This ready-to-use dashboard includes five powerful analytical pages designed for complete audit visibility:
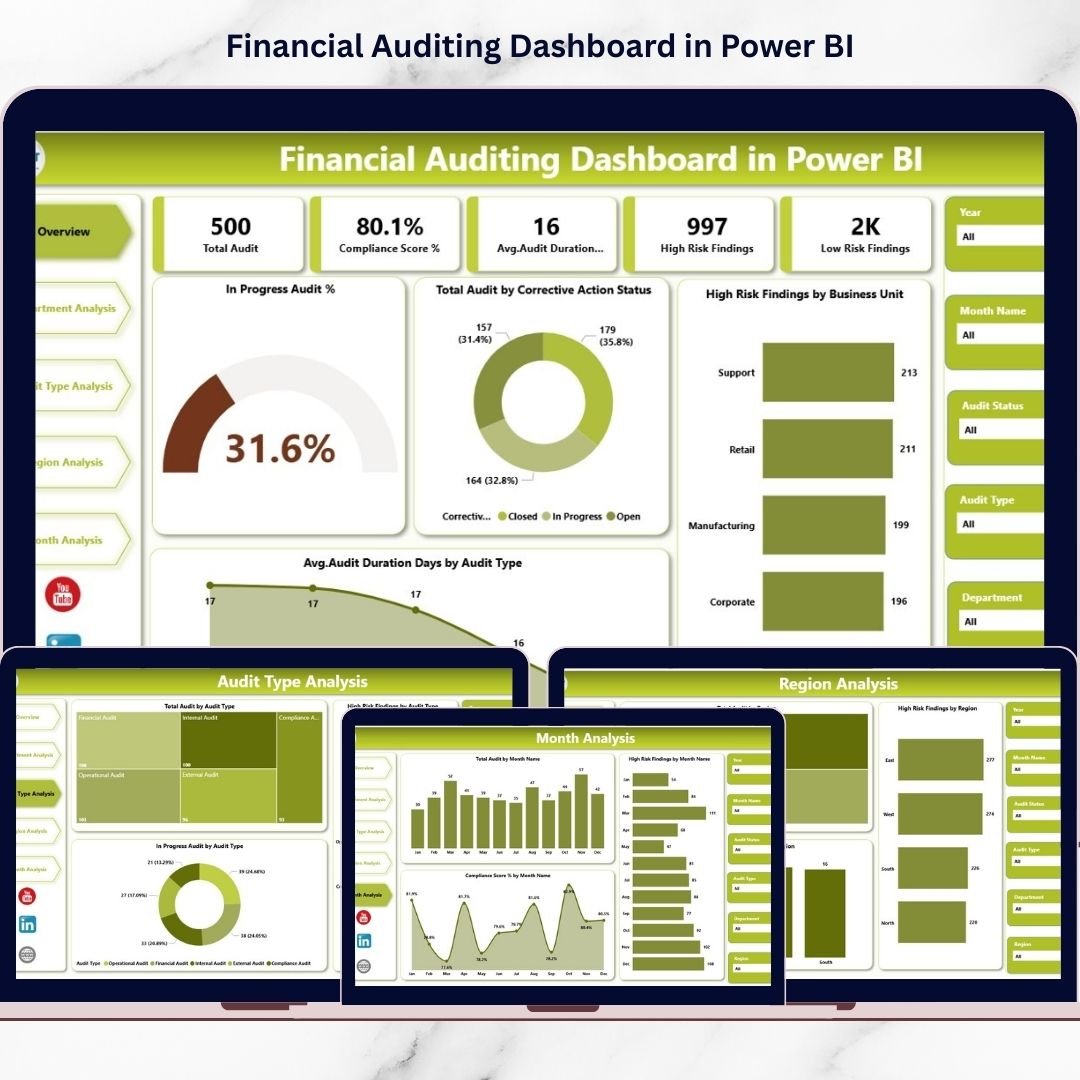
🔹 Overview Page – Executive Audit Control Panel
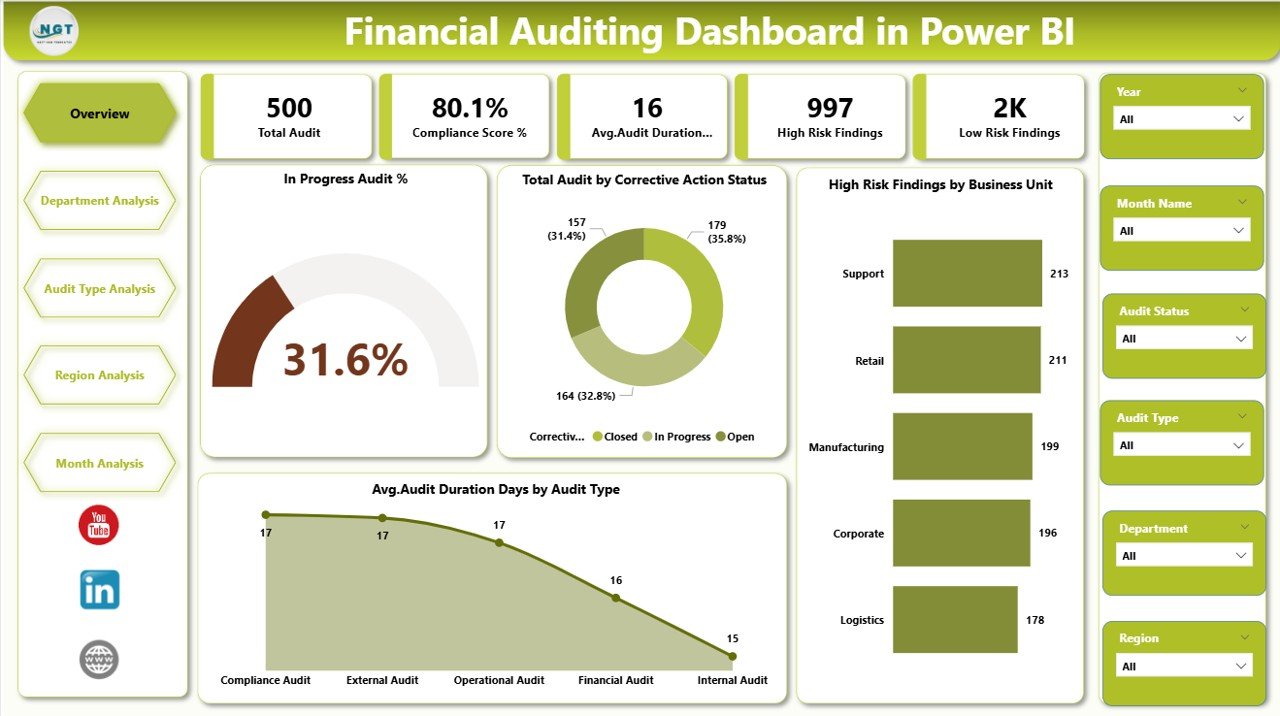
The main monitoring screen displaying:
-
In Progress Audit %
-
Total Audit by Corrective Action Status
-
High Risk Findings by Business Unit
-
Average Audit Duration (Days) by Audit Type
Executives can instantly assess audit performance and risk exposure.
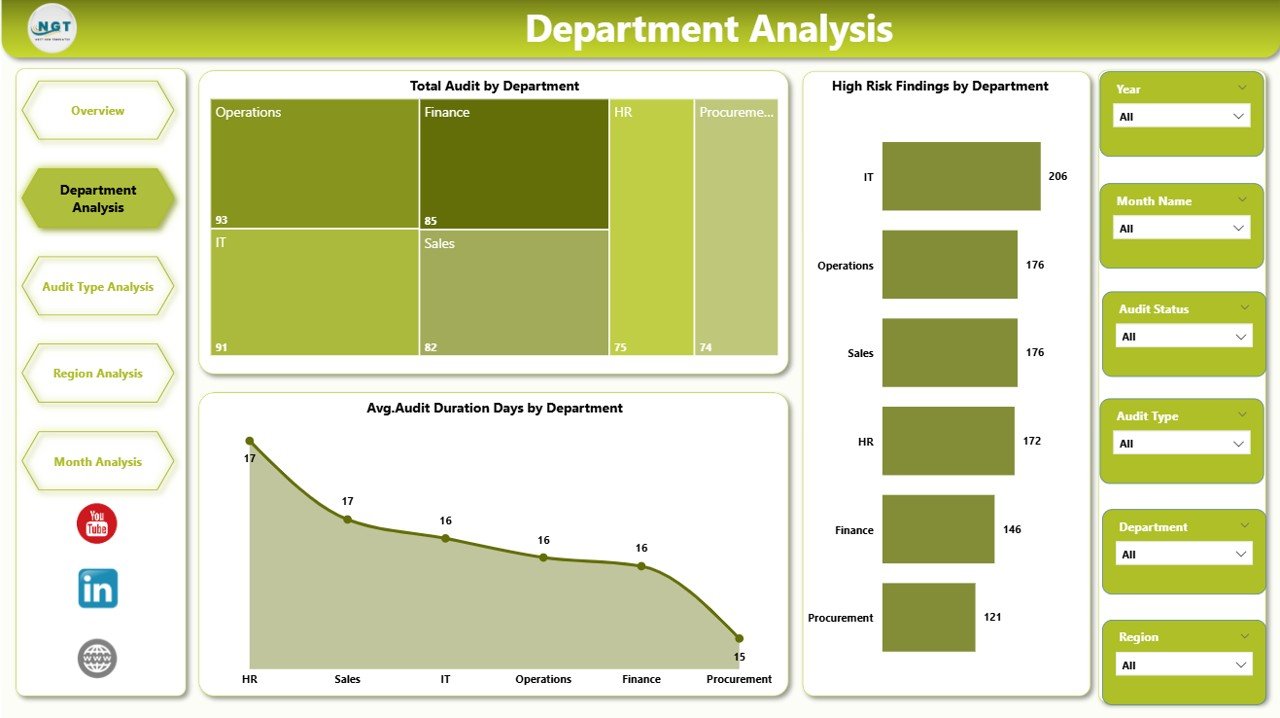
🔹 Department Analysis Page
Compare compliance performance across departments:
-
Total Audit by Department
-
High Risk Findings by Department
-
Average Audit Duration by Department
Helps identify departments requiring immediate attention.
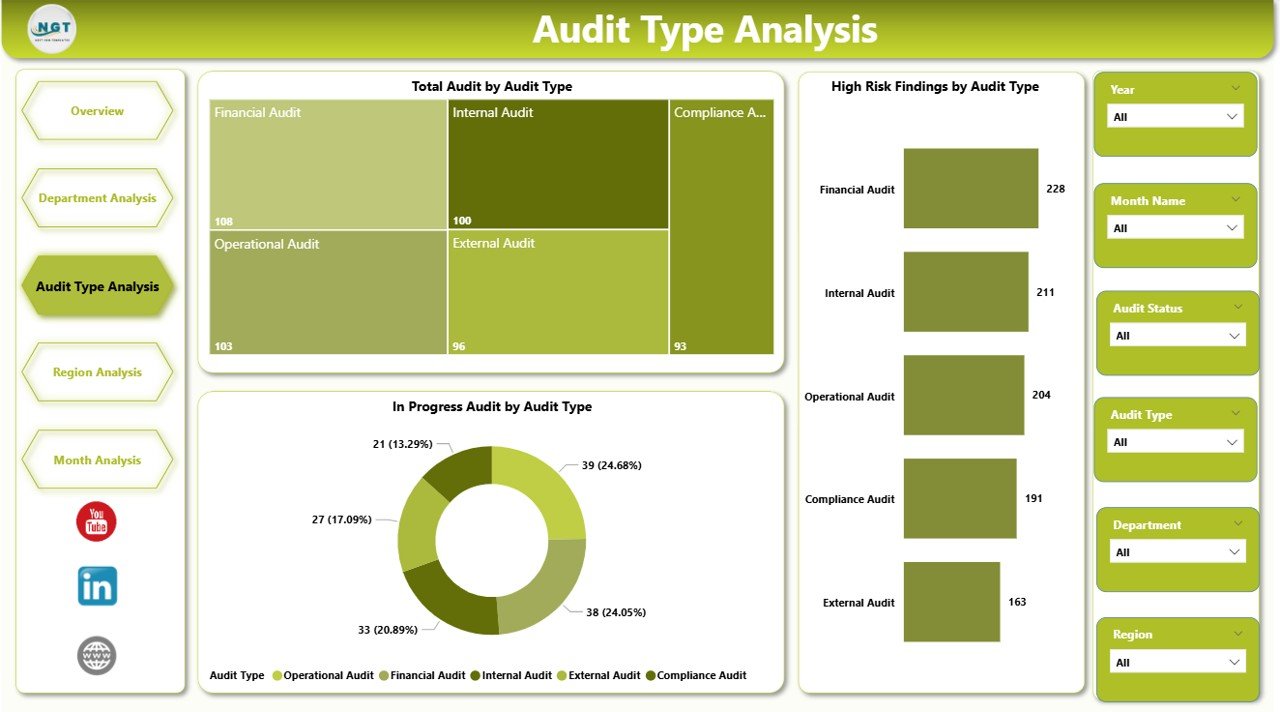
🔹 Audit Type Analysis Page
Evaluate performance across audit categories:
-
Total Audit by Audit Type
-
High Risk Findings by Audit Type
-
Average Audit Duration by Audit Type
Improves audit planning and resource allocation.
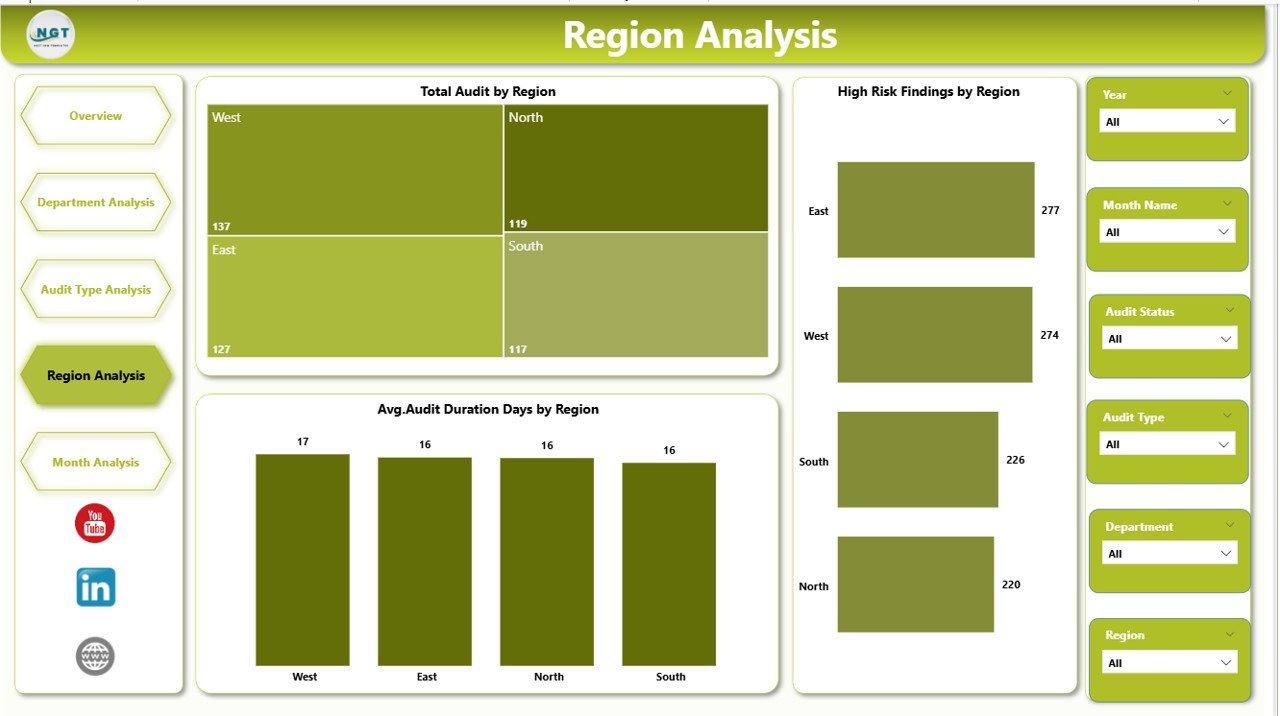
🔹 Region Analysis Page
Monitor geographic compliance performance:
-
Total Audit by Region
-
High Risk Findings by Region
-
Average Audit Duration by Region
Supports global governance and regional risk management.
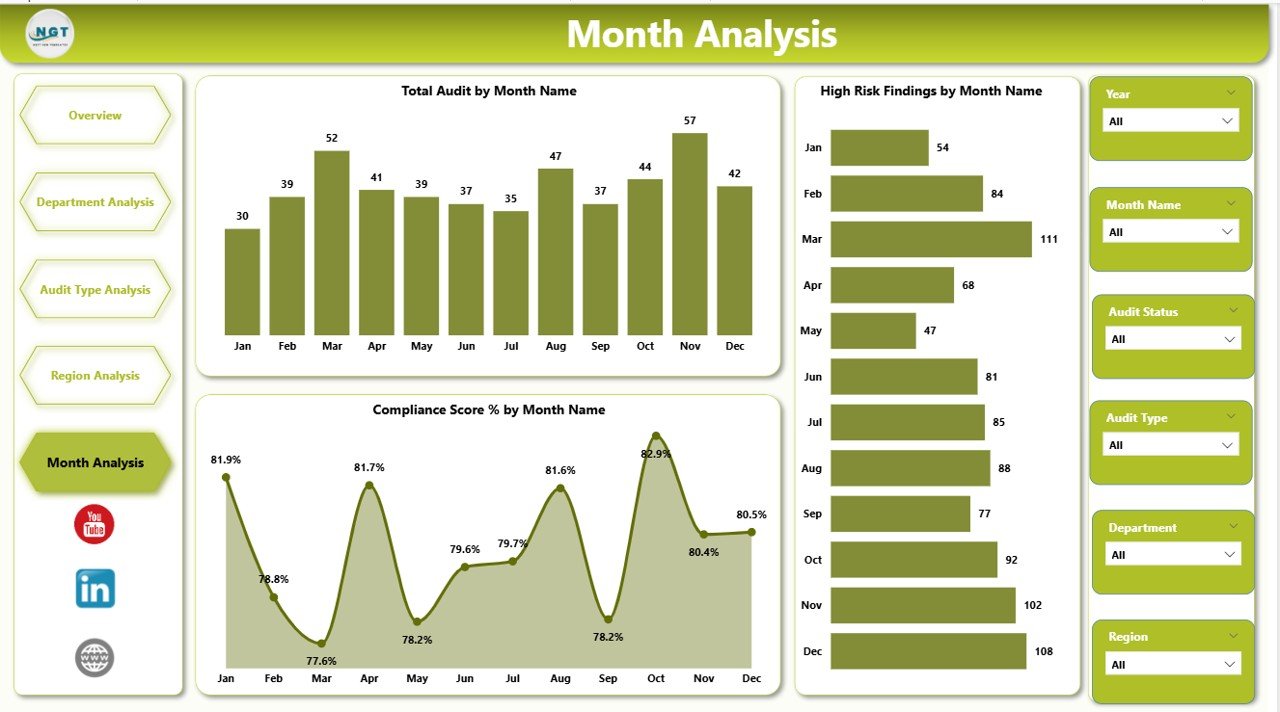
🔹 Month Analysis Page
Track audit trends over time:
-
Total Audit by Month
-
High Risk Findings by Month
-
Compliance Score % by Month
Helps organizations forecast risks and measure improvement initiatives.
🛠️ How to Use the Financial Auditing Dashboard in Power BI
Using the dashboard is simple and intuitive:
1️⃣ Import audit datasets into Power BI.
2️⃣ Refresh data connections.
3️⃣ Apply slicers to filter analysis dynamically.
4️⃣ Review KPI cards on the Overview page.
5️⃣ Navigate between analytical pages for deeper insights.
6️⃣ Share dashboards securely with stakeholders.
Because of its user-friendly design, both technical and non-technical users can operate the dashboard easily.
👥 Who Can Benefit from This Financial Auditing Dashboard
This dashboard is ideal for:
✔ Internal Audit Teams
✔ Finance Managers
✔ Compliance Officers
✔ Risk Management Teams
✔ CFOs & Executives
✔ Corporate Governance Departments
✔ Consulting & Advisory Firms
Any organization seeking stronger compliance monitoring and audit transparency will benefit significantly.
🚀 Business Benefits
Implementing this dashboard helps organizations:
✅ Improve audit visibility and governance
✅ Detect risks faster
✅ Reduce manual reporting effort
✅ Monitor corrective actions efficiently
✅ Enhance compliance tracking
✅ Standardize audit reporting processes
✅ Support data-driven decision making
Ultimately, organizations move from reactive auditing to proactive risk management.
### Click here to read the Detailed blog post
Visit our YouTube channel to learn step-by-step video tutorials
👉 Youtube.com/@PKAnExcelExpert