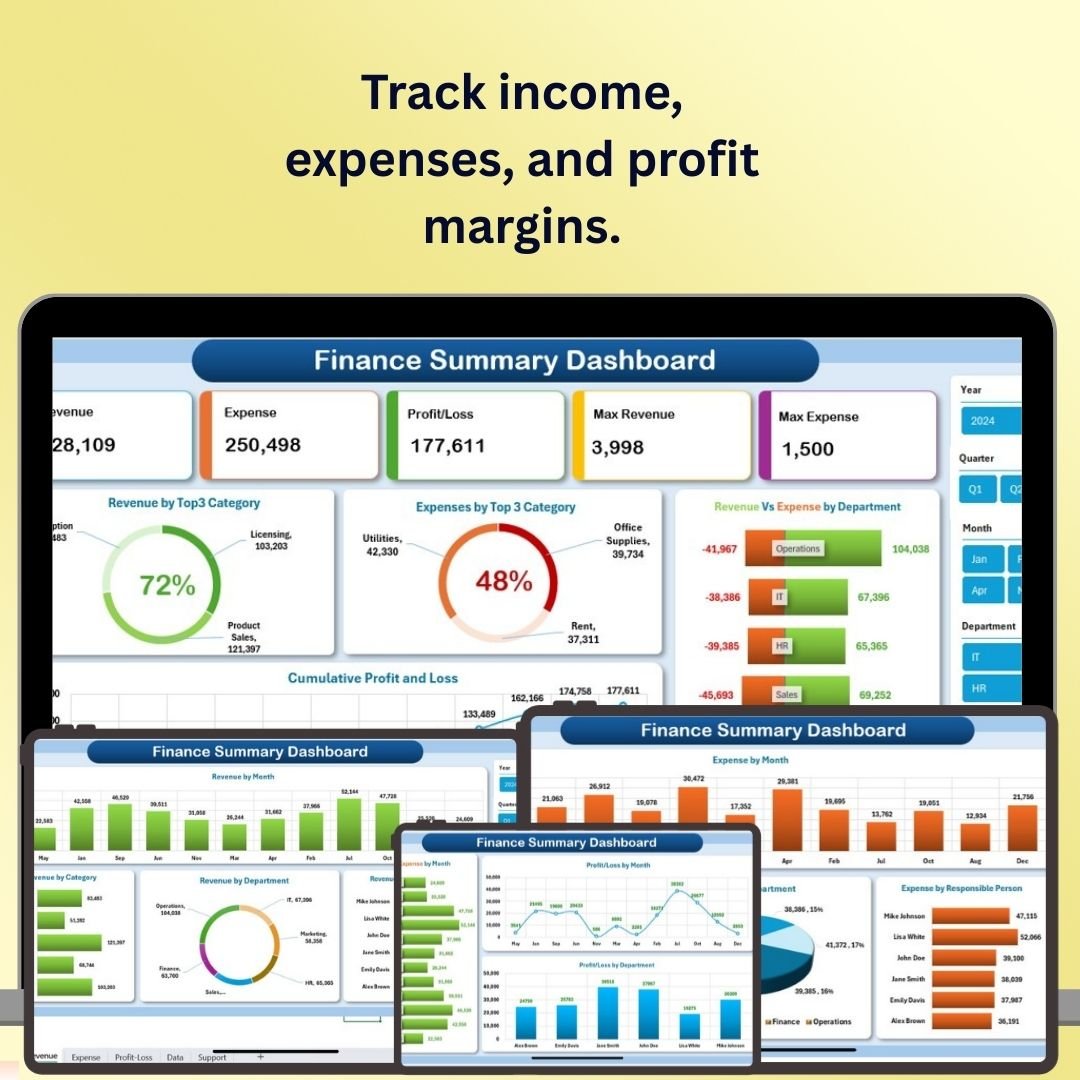
The Finance Summary Dashboard in Excel is a powerful and intuitive tool designed for finance managers, business owners, and accounting teams to monitor and manage financial performance. This Excel Dashboard Template provides a comprehensive view of key financial metrics, including income, expenses, profit margins, and cash flow, helping you track your financial health and make data-driven decisions.
With its user-friendly interface and customizable features, this dashboard allows you to visualize your financial data in a clear, actionable format, enabling better budget planning, forecasting, and financial reporting. If you manage multiple financial functions, explore our complete Financial Tools Collection for more specialized templates.
Key Features of the Finance Summary Dashboard in Excel:
📊 Comprehensive Financial Overview
Track key financial metrics, including revenue, expenses, profit margins, and net income, to get a clear picture of your business’s financial performance.
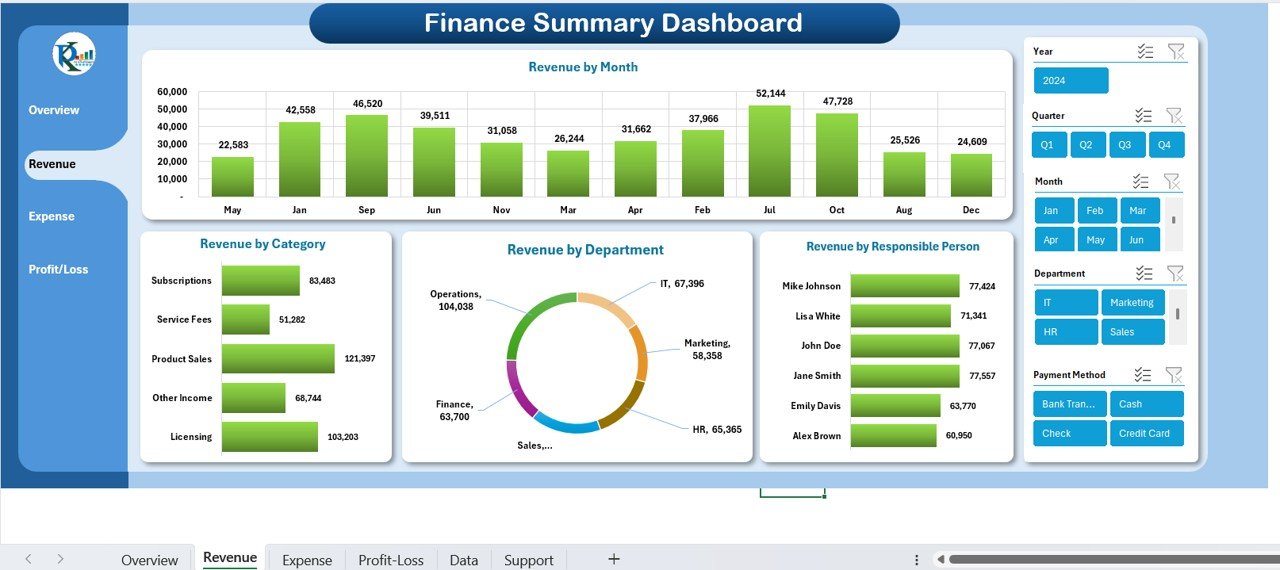
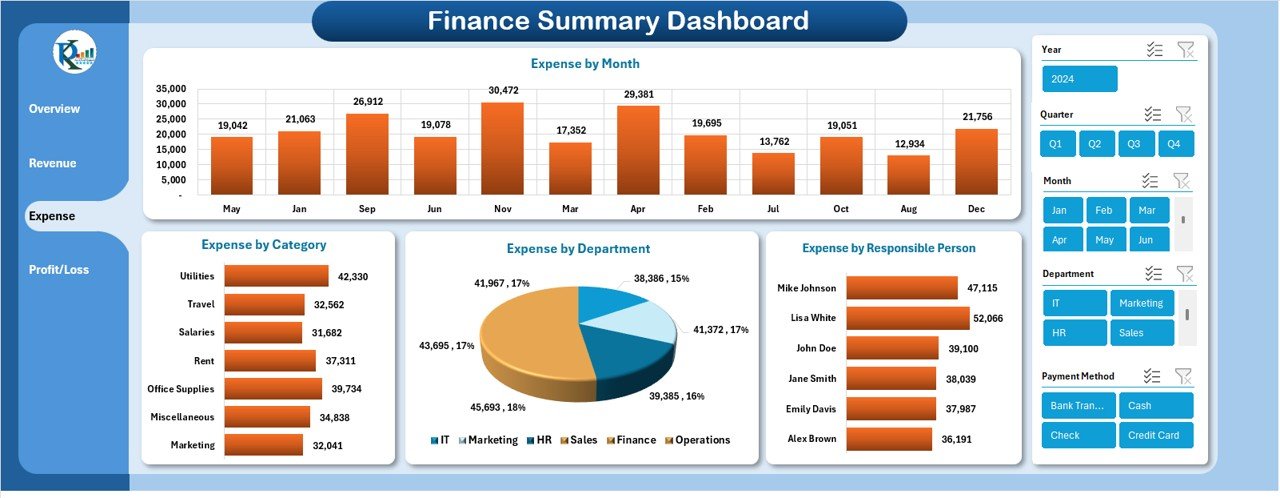
💸 Income and Expense Tracking
Monitor income streams and categorize expenses, making it easy to identify trends, cut costs, and improve financial efficiency.
💰 Cash Flow Monitoring
Track cash flow to ensure you have enough liquidity for day-to-day operations and long-term investments.
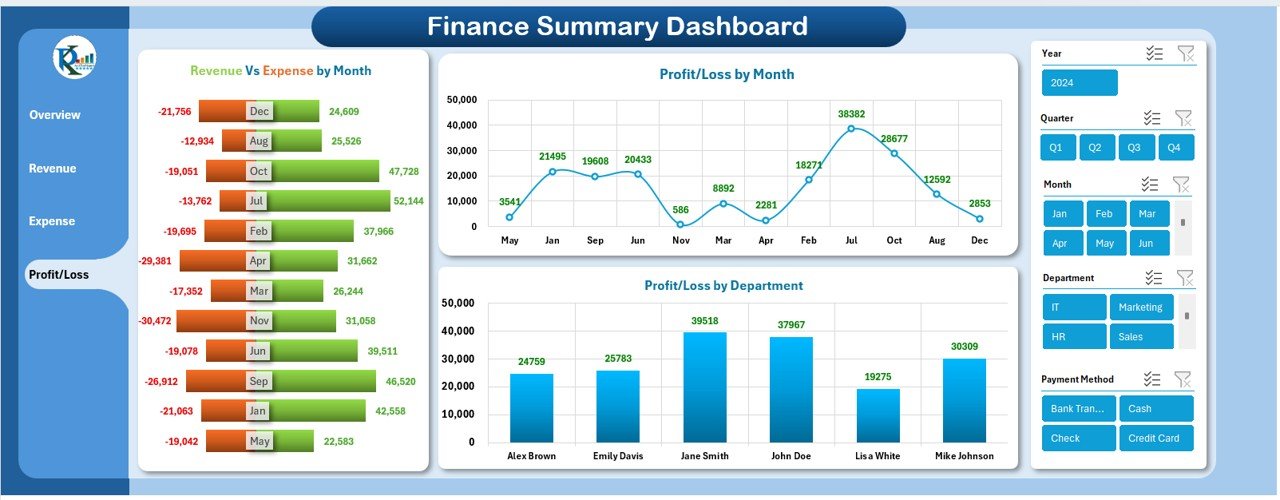
📈 Profit Margin Analysis
Analyze profit margins and identify areas where you can increase efficiency or reduce costs to improve profitability.
🧾 Financial Forecasting and Planning
Set financial goals and create projections to help plan future growth, track progress, and adjust your strategy based on real-time data.
🚀 Why You’ll Love the Finance Summary Dashboard in Excel:

✅ Track Key Financial Metrics – Monitor income, expenses, profit margins, and cash flow, ensuring that you have a clear understanding of your financial position.
✅ Optimize Cash Flow – Keep track of your cash flow to ensure that your business has sufficient liquidity for operations and investments.
✅ Analyze Profit Margins – Track profitability and identify ways to improve financial performance by optimizing costs and increasing revenue.
✅ Plan for the Future – Set goals, create financial projections, and track progress, ensuring that you are prepared for future growth and opportunities.
✅ Fully Customizable and Interactive – Fully customizable to suit your business needs, with interactive charts and real-time tracking for efficient financial decision-making.
✅ Data-Driven Insights – Use the dashboard to generate actionable insights, helping you make informed decisions based on your financial data.
What’s Inside the Finance Summary Dashboard in Excel:
-
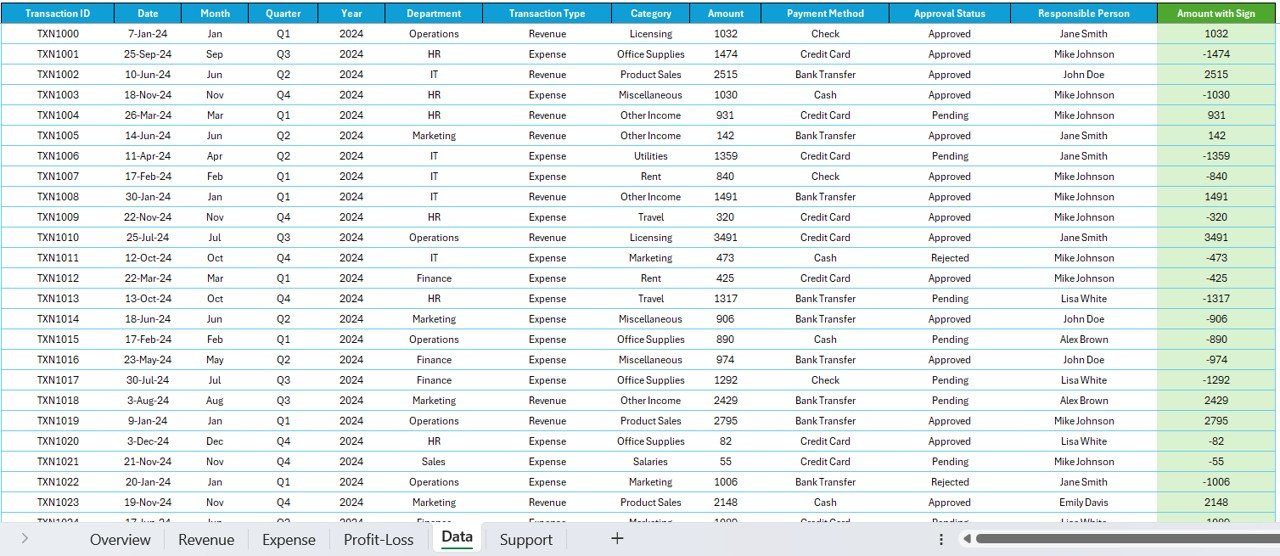
Income and Expense Tracking: Monitor income streams and track expenses to identify trends and make informed financial decisions.
-
Cash Flow Management: Track inflows and outflows to ensure your business has adequate liquidity for day-to-day operations.
-
Profit Margin Analysis: Analyze your business’s profit margins to measure efficiency and identify opportunities to increase profitability.
-
Financial Forecasting: Set financial goals, create projections, and track progress toward achieving them.
-
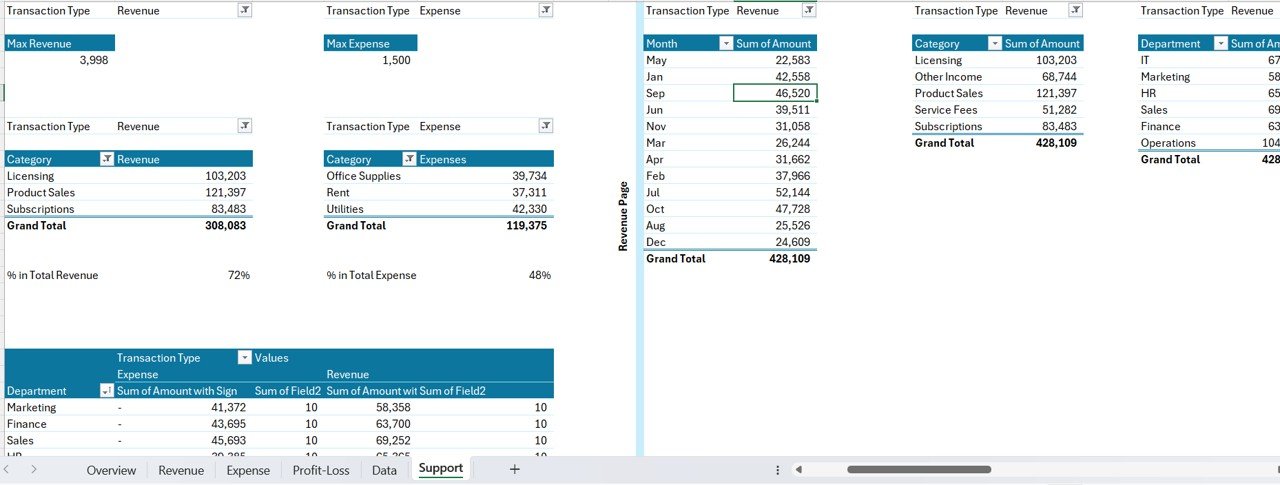
Real-Time Financial Reporting: Generate real-time reports summarizing key metrics, helping you stay updated on your business’s financial performance.
-
Customizable Charts and Graphs: Visualize key financial metrics with dynamic charts, graphs, and tables for easy analysis.
How to Use the Finance Summary Dashboard in Excel:
1️⃣ Download the Template – Instantly access your Excel file upon purchase.
2️⃣ Input Financial Data – Enter data related to income, expenses, profit margins, and cash flow to start tracking key financial metrics.
3️⃣ Track Financial Metrics – Use the dashboard to monitor your business’s financial health in real-time, including income, expenses, profit margins, and cash flow.
4️⃣ Analyze Profitability and Cash Flow – Identify trends and areas for improvement in profit margins, income streams, and cash flow.
5️⃣ Generate Financial Reports – Create customized financial reports that summarize your financial status, helping you make better financial decisions.
Who Can Benefit from the Finance Summary Dashboard in Excel:
-
Finance Managers
-
Accountants
-
Business Owners
-
Entrepreneurs
-
Small to Medium Enterprises (SMEs)
-
Startups
-
Nonprofit Organizations
-
Financial Advisors
The Finance Summary Dashboard in Excel is an invaluable tool for anyone looking to stay on top of their financial health. It provides an intuitive, comprehensive view of your business’s finances, making it easier to track, analyze, and optimize your financial performance for sustained success.
❓ Frequently Asked Questions
What financial metrics does the Finance Summary Dashboard in Excel track?
The Finance Summary Dashboard in Excel tracks key financial metrics including income, expenses, profit margins, cash flow, and net income. It provides a comprehensive financial overview with customizable charts, real-time reporting, and financial forecasting capabilities — all in a single Excel file.
Do I need advanced Excel skills to use this finance dashboard?
No. Simply open the Excel file, replace the sample data with your own financial data, and the dashboard updates automatically. All charts, graphs, and calculations are pre-built using Excel formulas — no macros or VBA required.
What is the best Excel dashboard for tracking business financial performance?
The Finance Summary Dashboard in Excel from NextGenTemplates is one of the most comprehensive finance dashboard templates available. It covers income tracking, expense management, cash flow monitoring, profit margin analysis, and financial forecasting in a single interactive Excel file. For a complete finance toolkit, check out the Finance & Accounting Command Center Bundle with 8 premium templates.
🔗 Also Check
🔹 Finance & Accounting Command Center – 8 Premium Templates – Get all 8 finance templates in Excel, Power BI & Google Sheets and save 46%.
🔹 Cash Flow Template in Excel – Track monthly cash inflows, outflows, and closing balances with automated waterfall charts.
🔹 Budget Forecasting Dashboard in Excel – Manage budgets with KPI cards, department analysis, and variance tracking.
✅ Click here to read the Detailed Blog Post
Visit our YouTube channel to learn step-by-step video tutorials
Youtube.com/@PKAnExcelExpert


Reviews
There are no reviews yet.