


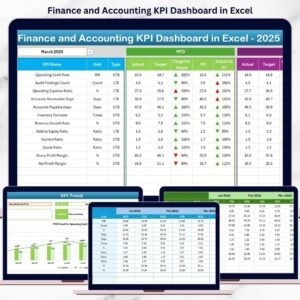
The Finance and Accounting Project Timeline KPI Dashboard in Excel is a dynamic and efficient tool designed to help finance and accounting professionals monitor and manage project timelines effectively. This Excel-based dashboard provides real-time insights into key performance indicators (KPIs) related to financial projects, ensuring that all tasks are completed on time, within budget, and according to the project’s financial objectives.
Whether you are managing a simple project or overseeing a complex financial initiative, this dashboard helps you track project milestones, deadlines, budget performance, and resource allocation. With its intuitive design and customizable features, this tool ensures that all critical aspects of project management are monitored and controlled, leading to more successful project outcomes.
Key Features of the Finance and Accounting Project Timeline KPI Dashboard in Excel
📊 Project Milestones & Deadline Tracking
Track key milestones and deadlines for your financial projects. Monitor the progress of each task and ensure that the project stays on schedule.
💰 Budget Performance & Cost Tracking
Monitor your project’s budget performance. Track expenditures against the allocated budget and identify potential overruns or cost savings opportunities.
📈 Resource Allocation Monitoring
Track the allocation and utilization of resources within your financial projects. Ensure that resources are being used efficiently and that no task is under-resourced.
🔑 Project Risk & Issue Management
Identify and manage potential risks or issues affecting the project’s progress. Use this KPI dashboard to stay proactive and mitigate risks before they impact the project.
📅 Time-Based Analysis & Reporting
Analyze project performance over different periods (daily, weekly, monthly). Use time-based performance analysis to adjust timelines, resources, and budgets for optimal project success.
⚙️ Customizable KPIs & Metrics
Customize the dashboard to include the KPIs and metrics most relevant to your specific financial project. Add additional columns or modify existing ones to match your project’s unique needs.
Why You’ll Love the Finance and Accounting Project Timeline KPI Dashboard in Excel
✅ Efficient Project Tracking
Track all aspects of your financial projects in one centralized dashboard. Monitor timelines, budgets, and resource allocation with ease.
✅ Optimize Budget Management
Monitor the budget throughout the project lifecycle. Quickly identify cost overruns or opportunities for savings and adjust the project plan accordingly.
✅ Improve Resource Allocation
Track the use of resources and ensure they are utilized efficiently. Optimize resource distribution to ensure each task is completed on time and within budget.
✅ Identify & Mitigate Risks Early
Monitor project risks and issues proactively. Identify potential problems early in the project timeline and mitigate them to ensure smooth project completion.
✅ Data-Driven Decision Making
Leverage real-time data and performance metrics to make informed decisions that drive project success and help meet financial goals.
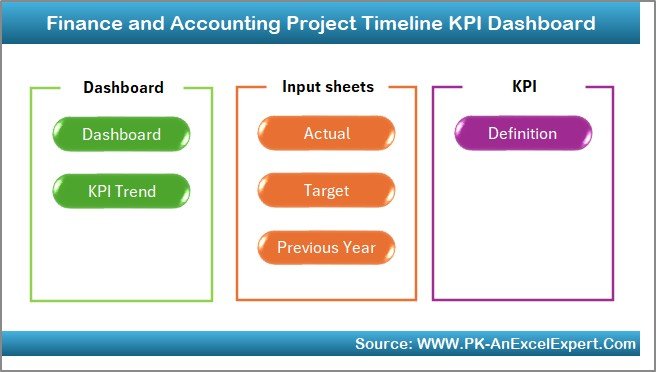
What’s Inside the Finance and Accounting Project Timeline KPI Dashboard in Excel?
-
Project Milestone & Deadline Tracking: Track key project milestones and deadlines.
-
Budget Performance & Cost Tracking: Monitor project expenditures against the budget.
-
Resource Allocation Monitoring: Track resource usage and allocation throughout the project.
-
Risk & Issue Management: Identify and track risks and issues affecting the project.
-
Time-Based Performance Analysis: Monitor project performance over different time periods.
-
Customizable Metrics & KPIs: Tailor the dashboard to your specific project requirements.
How to Use the Finance and Accounting Project Timeline KPI Dashboard in Excel
1️⃣ Download the Template: Instantly access the Finance and Accounting Project Timeline KPI Dashboard in Excel.
2️⃣ Input Project Data: Add your project milestones, deadlines, budget, and resource details into the dashboard.
3️⃣ Track Project Progress: Monitor the status of each task, milestone, and budget expenditure.
4️⃣ Analyze Project Data: Use time-based performance analysis to track trends and identify areas for improvement.
5️⃣ Optimize Project Outcomes: Make data-driven decisions to improve project timelines, resource allocation, and budget management.
Who Can Benefit from the Finance and Accounting Project Timeline KPI Dashboard in Excel?
🔹 Finance & Accounting Teams
🔹 Project Managers & Coordinators
🔹 Business Owners & Executives
🔹 Consultants & Advisors
🔹 Small & Medium Enterprises (SMBs)
🔹 Large Corporations with Financial Projects
🔹 Project Teams in Financial Services & Institutions
Ensure that your financial projects are completed on time and within budget with the Finance and Accounting Project Timeline KPI Dashboard in Excel. Track all aspects of project performance, including milestones, budgets, and resources, and make data-driven decisions to optimize project success.
Click here to read the Detailed blog post
Visit our YouTube channel to learn step-by-step video tutorials
Youtube.com/@PKAnExcelExpert


Reviews
There are no reviews yet.