

Managing finance and accounting performance demands accuracy, clarity, and speed. Yet many finance teams still rely on scattered Excel files, manual calculations, and delayed reports. As a result, insights arrive late, risks go unnoticed, and decision-making becomes reactive instead of strategic.
That is exactly why the Finance and Accounting KPI Dashboard in Excel becomes a powerful and practical solution 📊🚀.
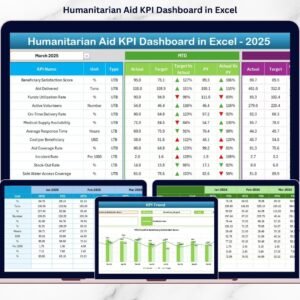
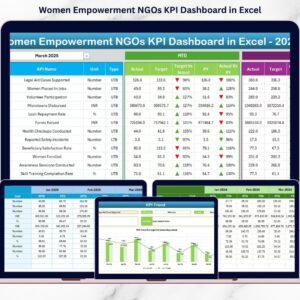
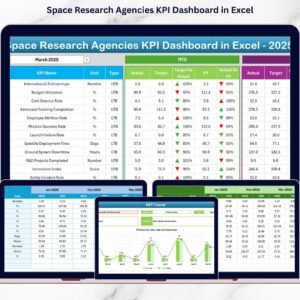
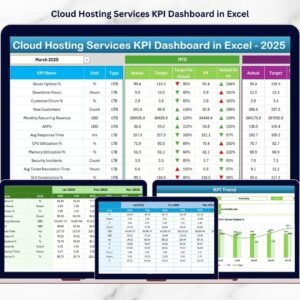
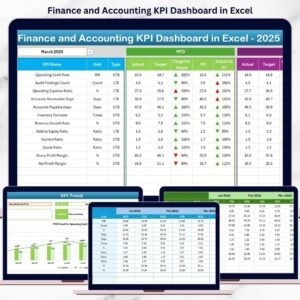
This ready-to-use Excel dashboard brings all critical financial KPIs into one structured, interactive, and easy-to-use workbook. Instead of switching between multiple spreadsheets, finance professionals can track Month-to-Date (MTD) and Year-to-Date (YTD) performance, compare targets, analyze trends, and identify financial risks in real time. Because the dashboard is built entirely in Microsoft Excel, it remains flexible, affordable, and accessible—without requiring expensive BI tools or advanced technical skills.
Designed for finance leaders, accounting teams, and business owners, this dashboard transforms raw financial data into clear, actionable insights that support faster and more confident decisions.
⭐ Key Features of Finance and Accounting KPI Dashboard in Excel
📊 Centralized Financial Performance View
Track all key finance and accounting KPIs in one consolidated dashboard.
📅 MTD & YTD Performance Tracking
Monitor short-term monthly results and long-term yearly performance side by side.
🎯 Target vs Actual Comparison
Instantly identify KPIs that meet or miss targets using visual indicators.
📈 Previous Year Comparison
Analyze year-over-year performance to understand growth, decline, or stability.
🧭 Easy Navigation with Home Sheet
Jump between dashboard sections quickly using dedicated navigation buttons.
📉 Trend Analysis for Better Forecasting
Visual trend charts help detect patterns, seasonality, and risks early.
📦 What’s Inside the Finance and Accounting KPI Dashboard in Excel
This professionally designed Excel workbook includes seven well-structured worksheets, each serving a specific analytical purpose:
🏠 Home Sheet
Acts as the navigation hub with six buttons for quick access to key sections.
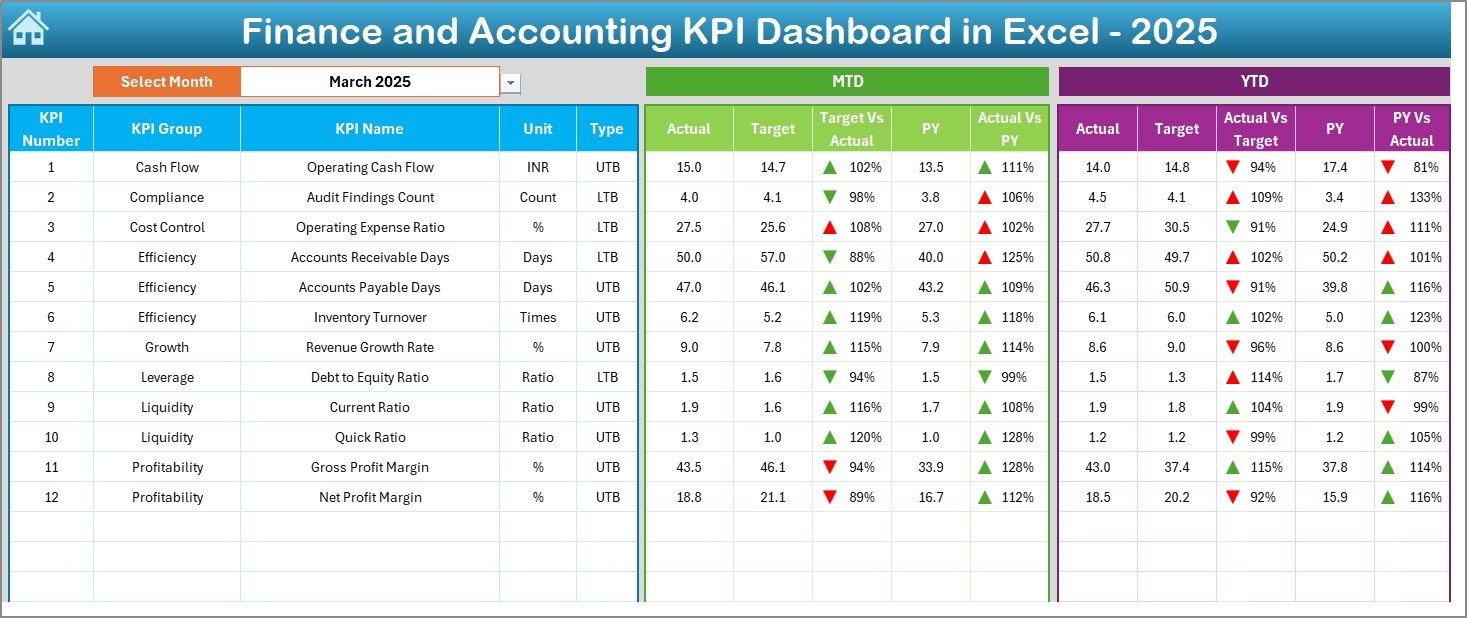
📊 Dashboard Sheet
The main performance view displaying:
-
Month selection drop-down (cell D3)
-
MTD and YTD sections for each KPI
-
Actual, Target, and Previous Year values
-
Target vs Actual and PY vs Actual comparisons
-
Conditional formatting with up/down arrows for instant interpretation
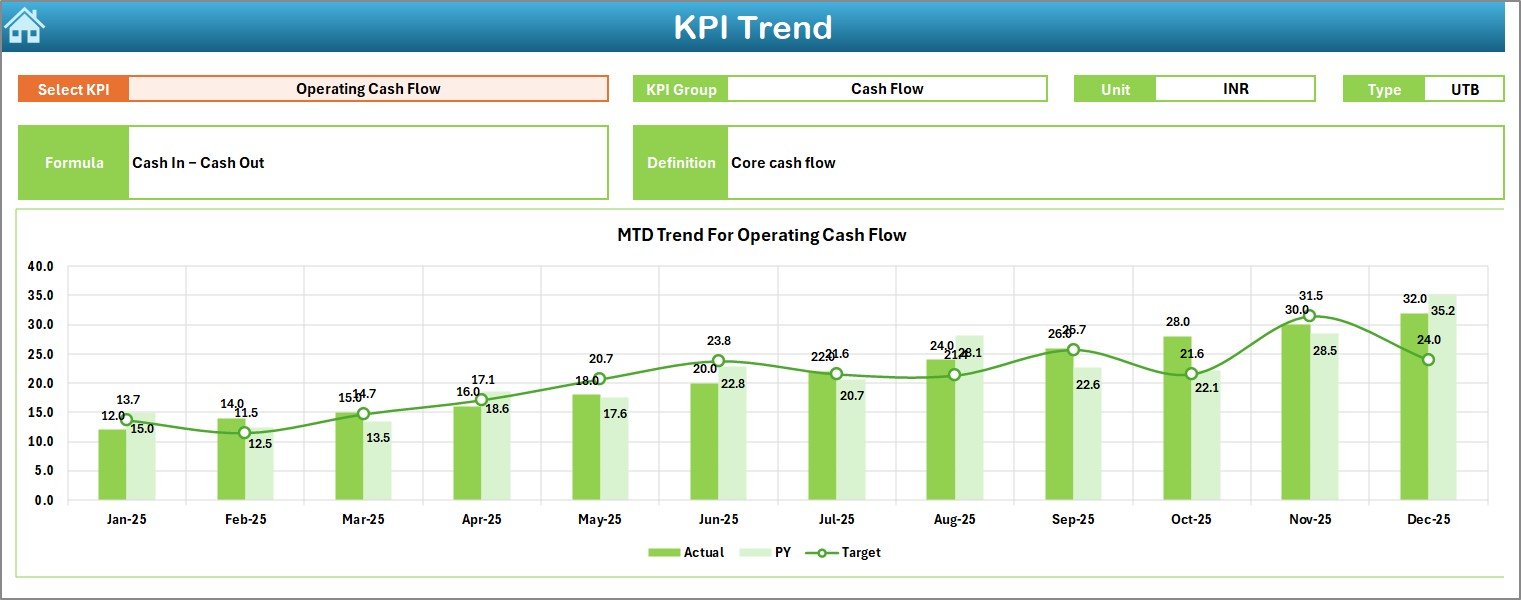
📈 KPI Trend Sheet
Provides deep-dive KPI analysis with:
-
KPI selection drop-down (cell C3)
-
KPI group, unit, type (LTB/UTB), formula, and definition
-
MTD and YTD trend charts for Actual, Target, and PY values
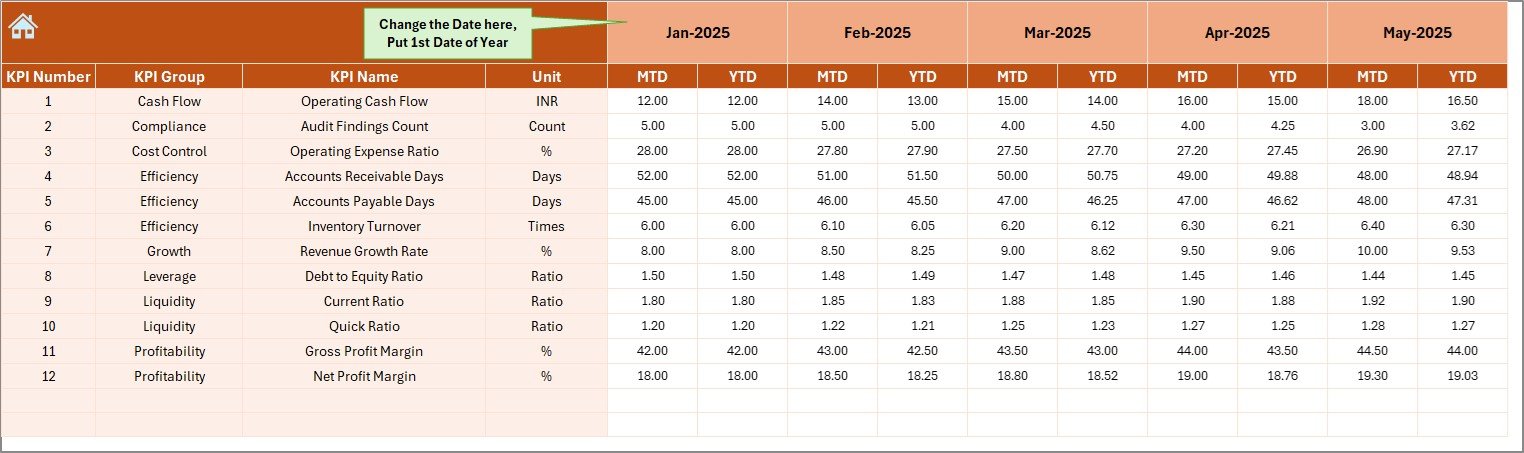
📝 Actual Numbers Input Sheet
Where users enter real MTD and YTD actual financial values.
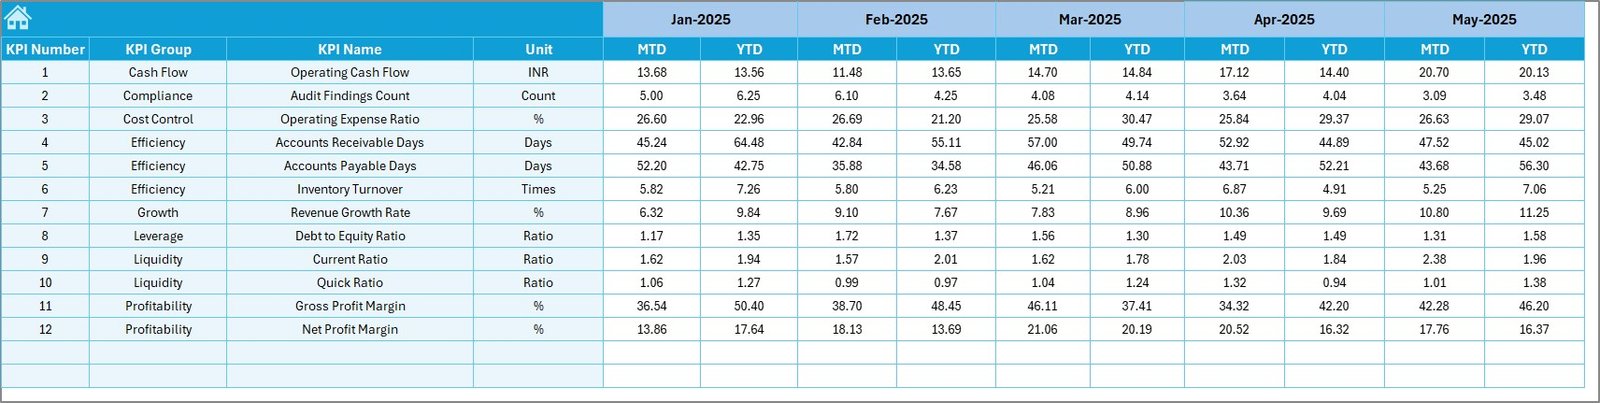
🎯 Target Sheet
Stores planned MTD and YTD targets for each KPI.
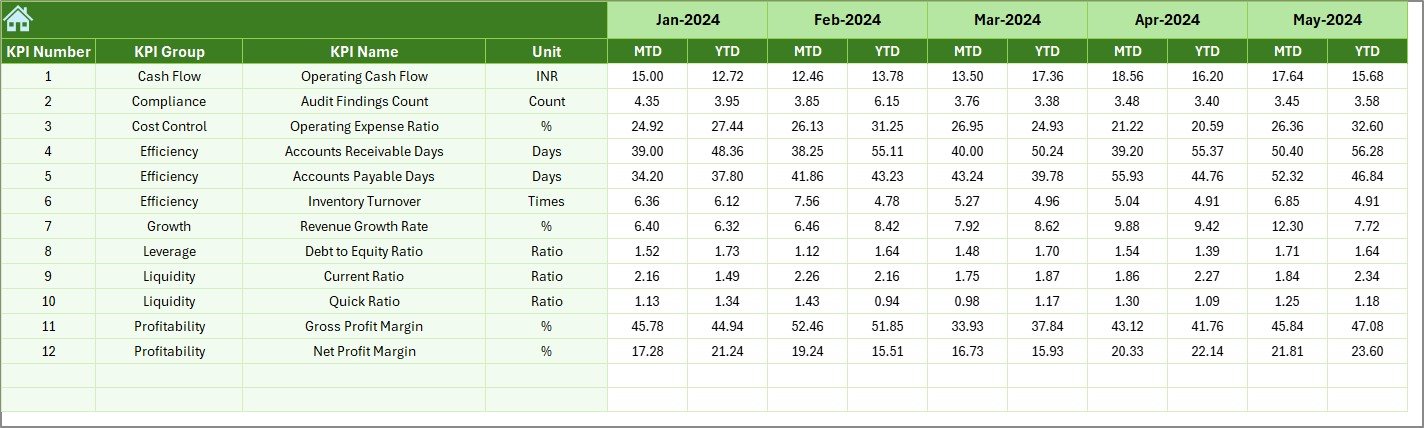
📅 Previous Year Number Sheet
Captures last year’s MTD and YTD values for year-over-year comparison.
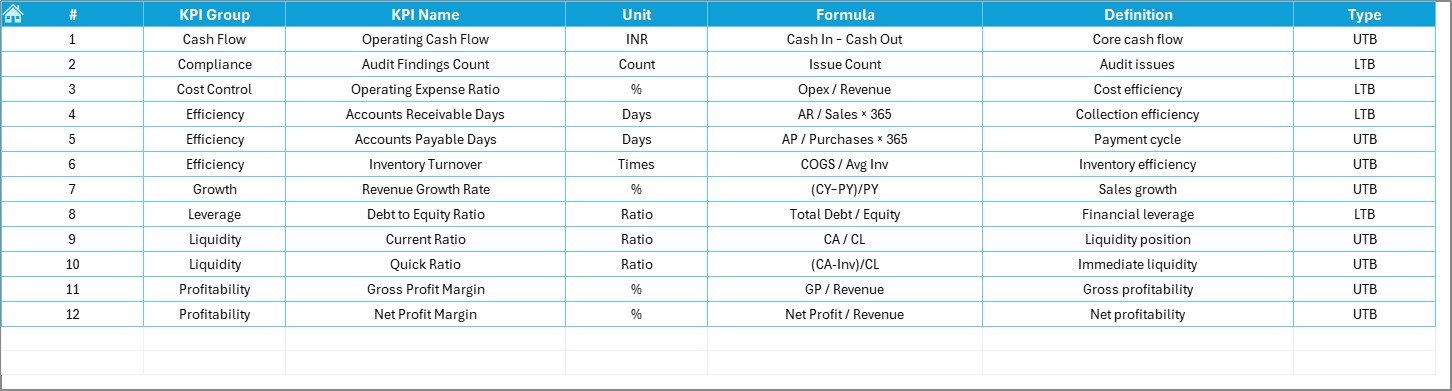
📘 KPI Definition Sheet
Documents KPI names, groups, units, formulas, and definitions to ensure clarity and governance.
🛠️ How to Use the Finance and Accounting KPI Dashboard in Excel
Using the dashboard is simple and efficient:
1️⃣ Enter actual financial data in the Actual Numbers sheet
2️⃣ Define targets in the Target sheet
3️⃣ Add historical data in the Previous Year Number sheet
4️⃣ Select the reporting month
5️⃣ Instantly view updated KPIs, trends, and indicators
Because calculations and visuals update automatically, teams save time and reduce manual errors.
👥 Who Can Benefit from This Finance and Accounting KPI Dashboard in Excel
This dashboard is ideal for:
💼 Finance Managers
📊 Accounting Teams
🏢 CFOs & Controllers
📈 Financial Analysts
🧾 Auditors
👔 Business Owners
Whether managing a small business or a large enterprise, this dashboard adapts easily to your financial reporting needs.


Reviews
There are no reviews yet.