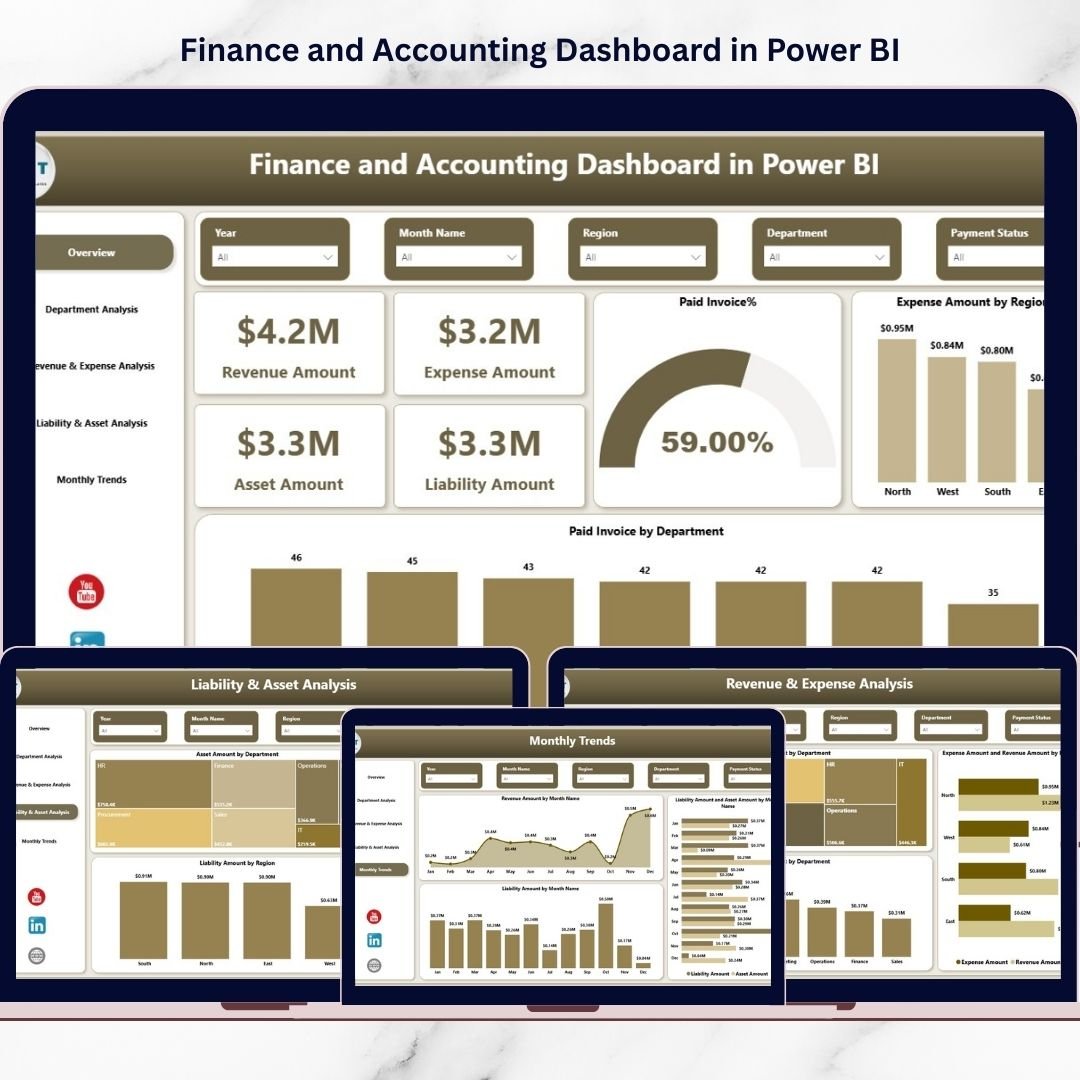
Are you still managing your company’s finances using scattered spreadsheets and manual reports? Stop wasting time and start making smarter financial decisions today.The Finance and Accounting Dashboard in Power BI is a ready-to-use, professionally designed solution that transforms complex accounting data into powerful visual insights. Instead of juggling multiple Excel sheets, you can monitor revenue, expenses, assets, liabilities, unpaid invoices, and tax amounts in one centralized and interactive dashboard.
With dynamic slicers, drill-down analysis, and real-time visuals, this dashboard gives finance teams complete clarity. As a result, you reduce financial risks, improve reporting accuracy, and gain full control over your company’s financial health.
✨ Key Features of Finance and Accounting Dashboard in Power BI
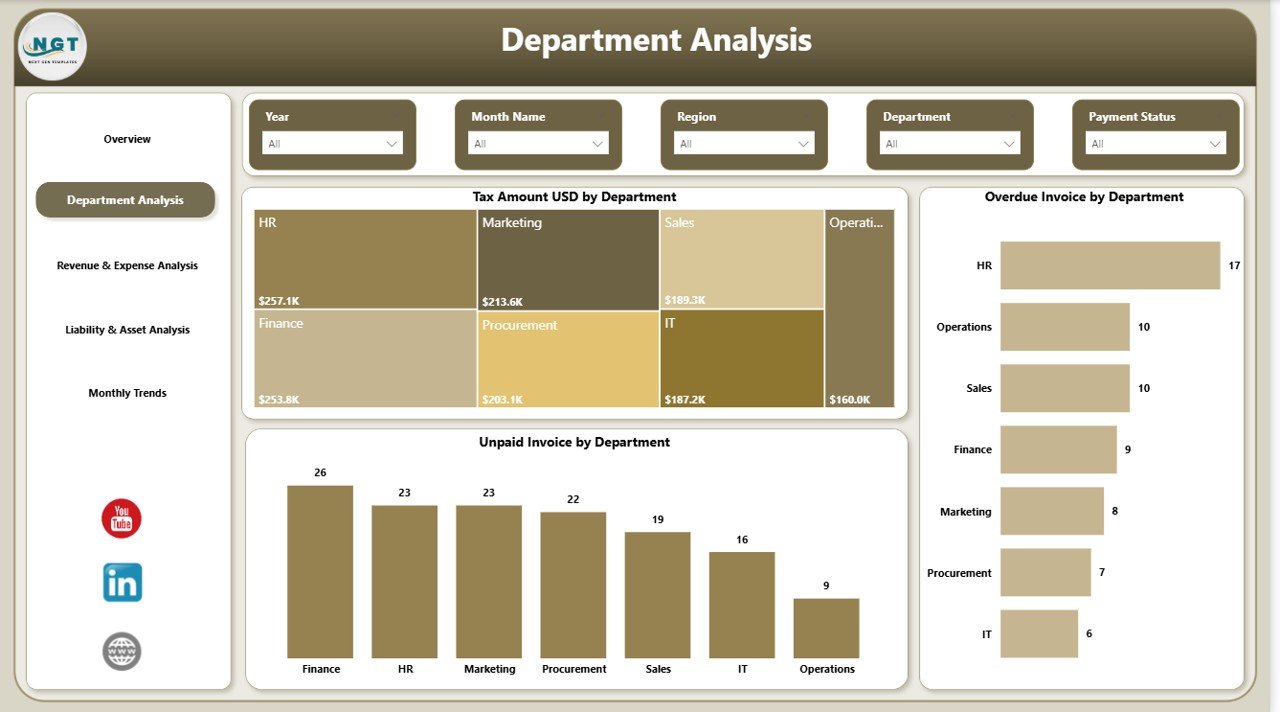
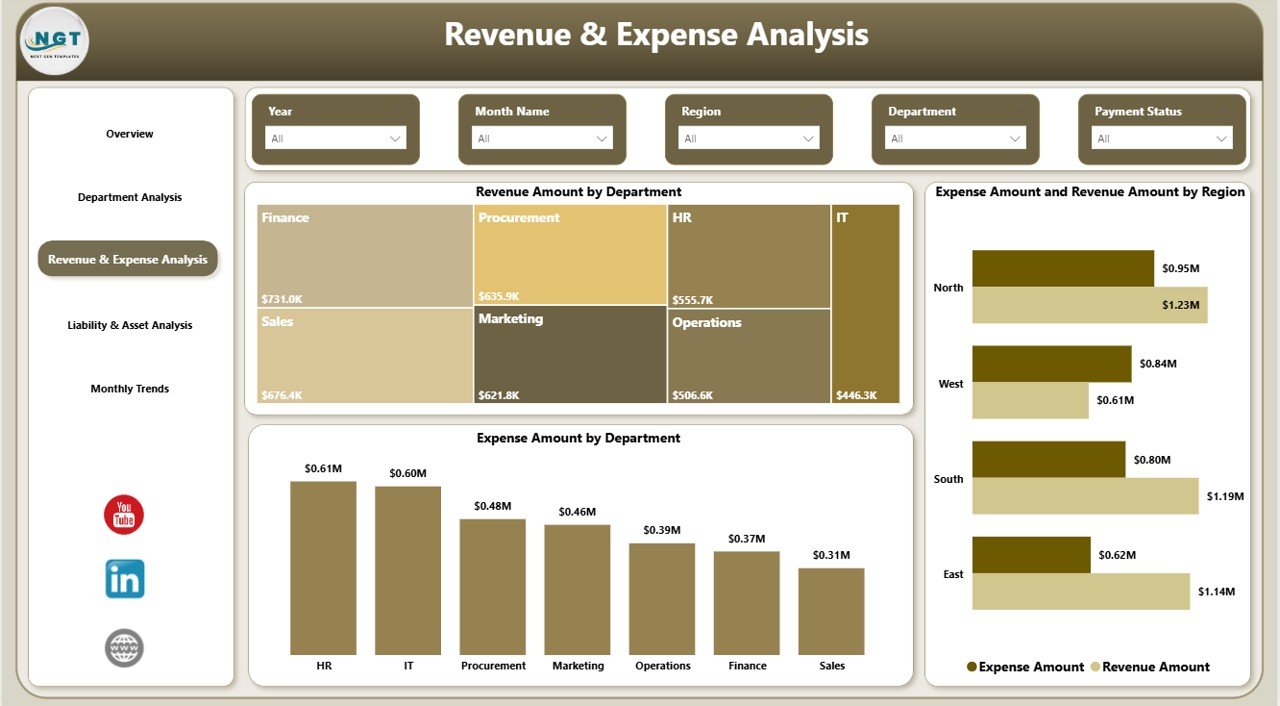
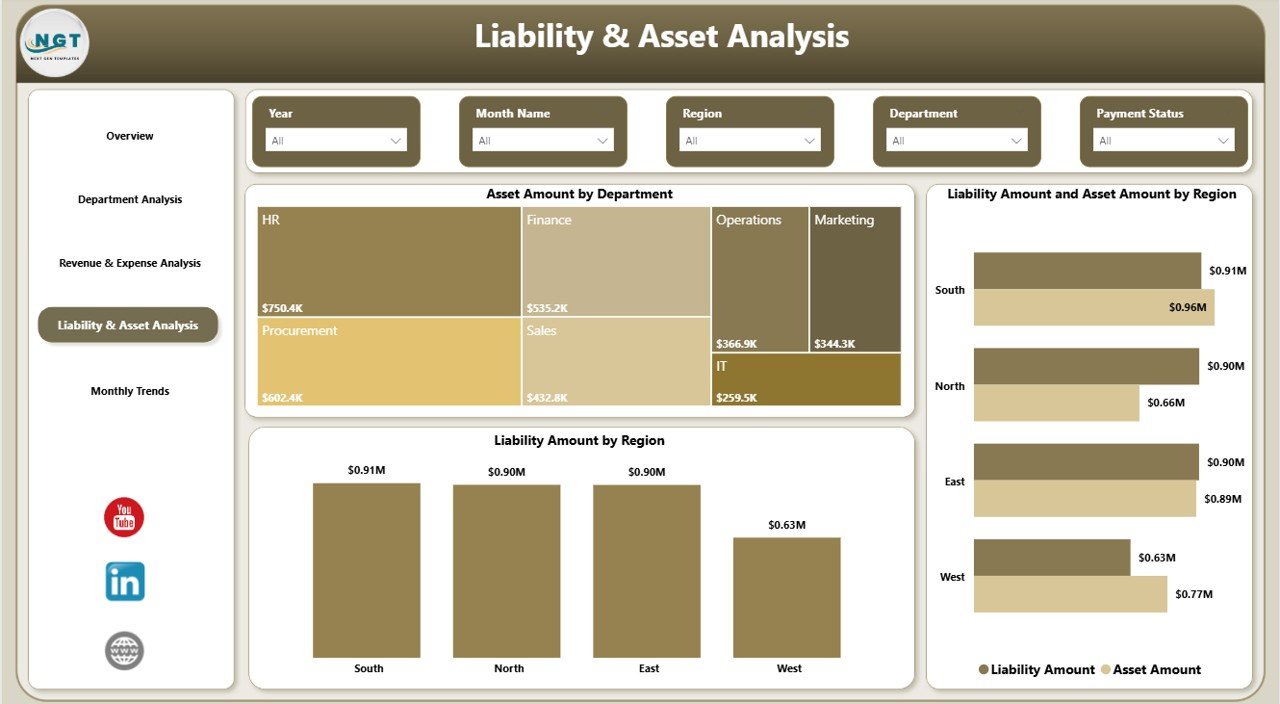
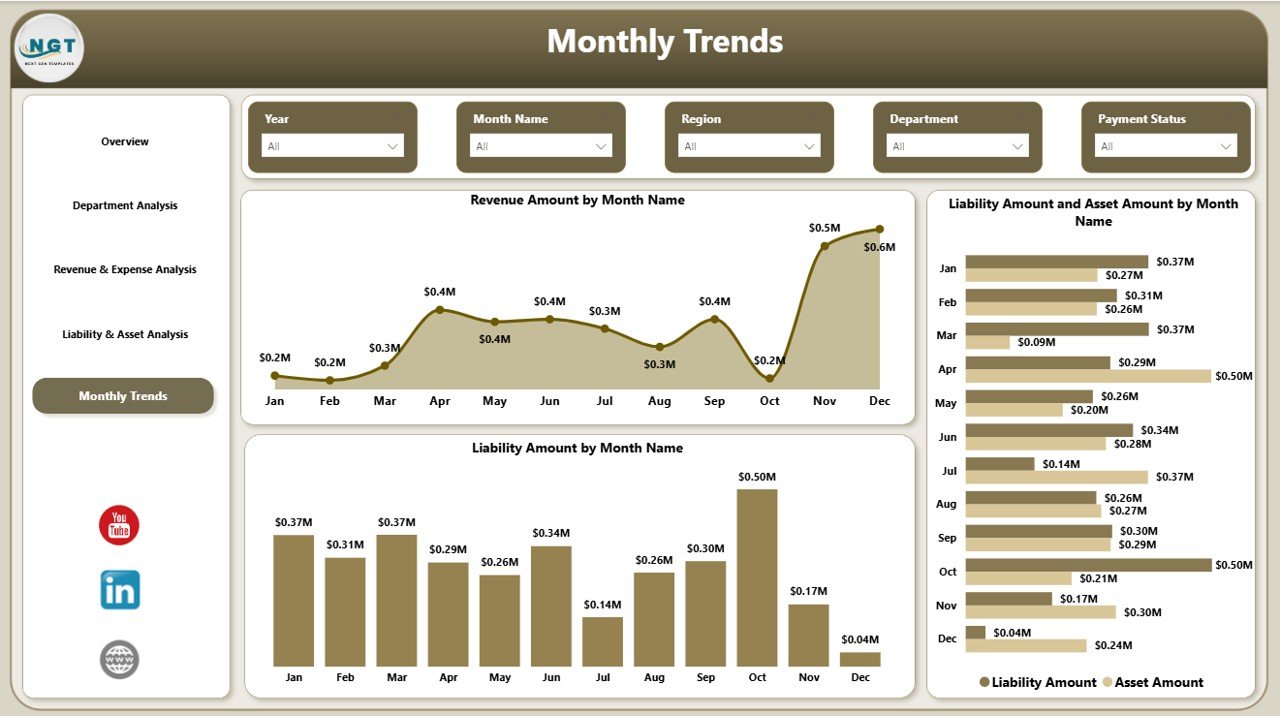
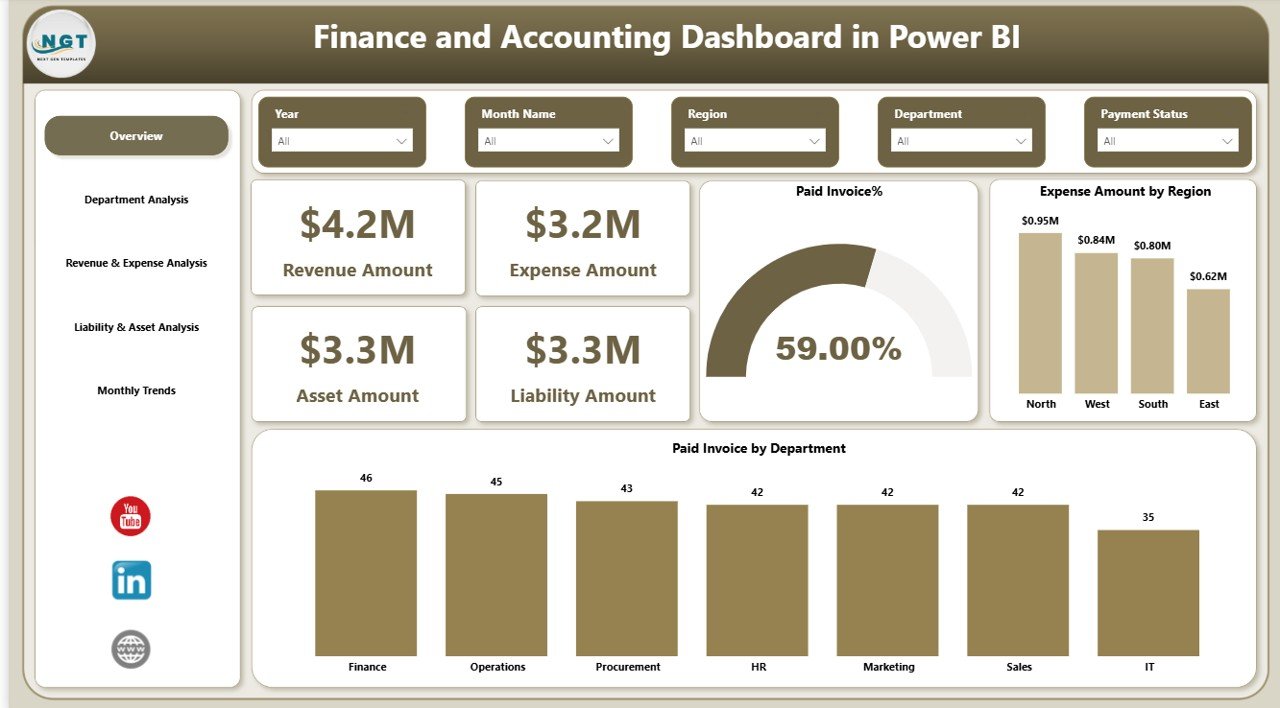
📊 5 Powerful Dashboard Pages – Overview, Department Analysis, Revenue & Expense Analysis, Liability & Asset Analysis, and Monthly Trends.
💰 Real-Time KPI Cards – Instantly track Revenue, Expenses, Assets, and Liabilities.
📈 Department & Region Filtering – Use slicers to analyze financial data by department, region, and time period.
📉 Invoice Performance Tracking – Monitor Paid Invoice %, Overdue Invoices, and Unpaid Invoices.
🏦 Asset & Liability Monitoring – Evaluate financial stability with asset-to-liability comparisons.
📅 Monthly Trend Analysis – Identify revenue growth patterns and rising liabilities over time.
🔎 Interactive Drill-Down Reports – Click visuals to explore deeper financial insights.
⚡ Professional Presentation Ready – Impress stakeholders with clean, executive-level financial reporting.
📦 What’s Inside the Finance and Accounting Dashboard in Power BI
When you download this product, you get:
✔️ A fully designed Power BI (.pbix) file
✔️ Structured financial data model
✔️ Interactive slicers (Department, Region, Time Period)
✔️ Revenue & Expense comparison charts
✔️ Asset & Liability analysis visuals
✔️ Paid, Overdue, and Unpaid Invoice tracking
✔️ Tax amount tracking by department
✔️ Monthly financial trend charts
✔️ Clean and professional layout for executive reporting
Everything is pre-built and organized. Therefore, you can start using it immediately without designing anything from scratch.
🚀 How to Use the Finance and Accounting Dashboard in Power BI
Using this dashboard is simple and straightforward:
1️⃣ Open the Power BI file.
2️⃣ Connect or update your financial dataset.
3️⃣ Refresh the data.
4️⃣ Use slicers to filter by department, region, or month.
5️⃣ Analyze KPIs and identify financial gaps.
Because the dashboard structure is already designed, you only need to update your accounting data. Within minutes, you can generate professional financial reports.
🎯 Who Can Benefit from This Finance and Accounting Dashboard in Power BI
👔 CFOs – Evaluate financial stability and present insights to stakeholders confidently.
📊 Finance Managers – Track unpaid invoices, monitor departmental expenses, and improve cash flow.
🧾 Accountants – Simplify reporting and reduce manual work.
🏢 Business Owners – Understand profit margins and identify cost-saving opportunities.
🏭 Multi-Department Companies – Compare financial performance across departments and regions.
If your business generates financial data daily, this dashboard will transform how you analyze it.
This dashboard does more than display numbers. It helps you:
✔ Improve cash flow management
✔ Detect financial risks early
✔ Compare revenue with expenses clearly
✔ Monitor asset-to-liability balance
✔ Make faster, data-driven decisions
Instead of reacting to financial problems, you can stay ahead of them.
Click here to read the Detailed blog post
Watch the step-by-step video tutorial:


