Fashion retail doesn’t wait—and neither should your reporting. Trends shift fast, customer preferences change every season, and competitors react instantly. But if your boutique is still relying on manual spreadsheets and scattered reports, you’re always one step behind. You might be selling well… yet still not know which boutique is truly profitable, which product category drives margins, or which sales channel is wasting money.
That’s why we built the Fashion Boutiques Dashboard in Power BI 👗📊
It’s a ready-to-use Power BI analytics solution designed to turn raw boutique sales data into clean, interactive insights—so you can track performance, spot trends, and make faster decisions with confidence.
This dashboard brings everything into one place: Net Sales, Revenue, Profit Margin %, Costs, Target Achievement, and business trends across boutique locations, product categories, sales channels, regions, months, and customer segments. With interactive slicers, dynamic visuals, and clear KPI tracking, even non-technical users can explore the data without complexity.
If you want to stop guessing and start managing your boutique like a data-driven brand, this dashboard is your shortcut.
Key Feature of Fashion Boutiques Dashboard in Power BI
🚀 Ready-to-use Power BI dashboard designed for boutique sales and profitability analytics
🎛️ Interactive slicers & filters to analyze performance instantly by:
-
Boutique Name
-
Product Category
-
Sales Channel
-
Region
-
Month
-
Customer Segment
📌 KPI cards and performance indicators for quick executive-level decisions
📊 5-page analytics structure covering every major retail angle
💰 Profit Margin % insights to highlight what’s truly profitable (not just selling)
🎯 Target Sales tracking to measure team performance and achievement
📈 Trend and seasonality views for smarter forecasting and planning
🛍️ Omnichannel analysis to compare online vs offline profitability
⏱️ Faster reporting + less manual work with automated visuals and refreshable data
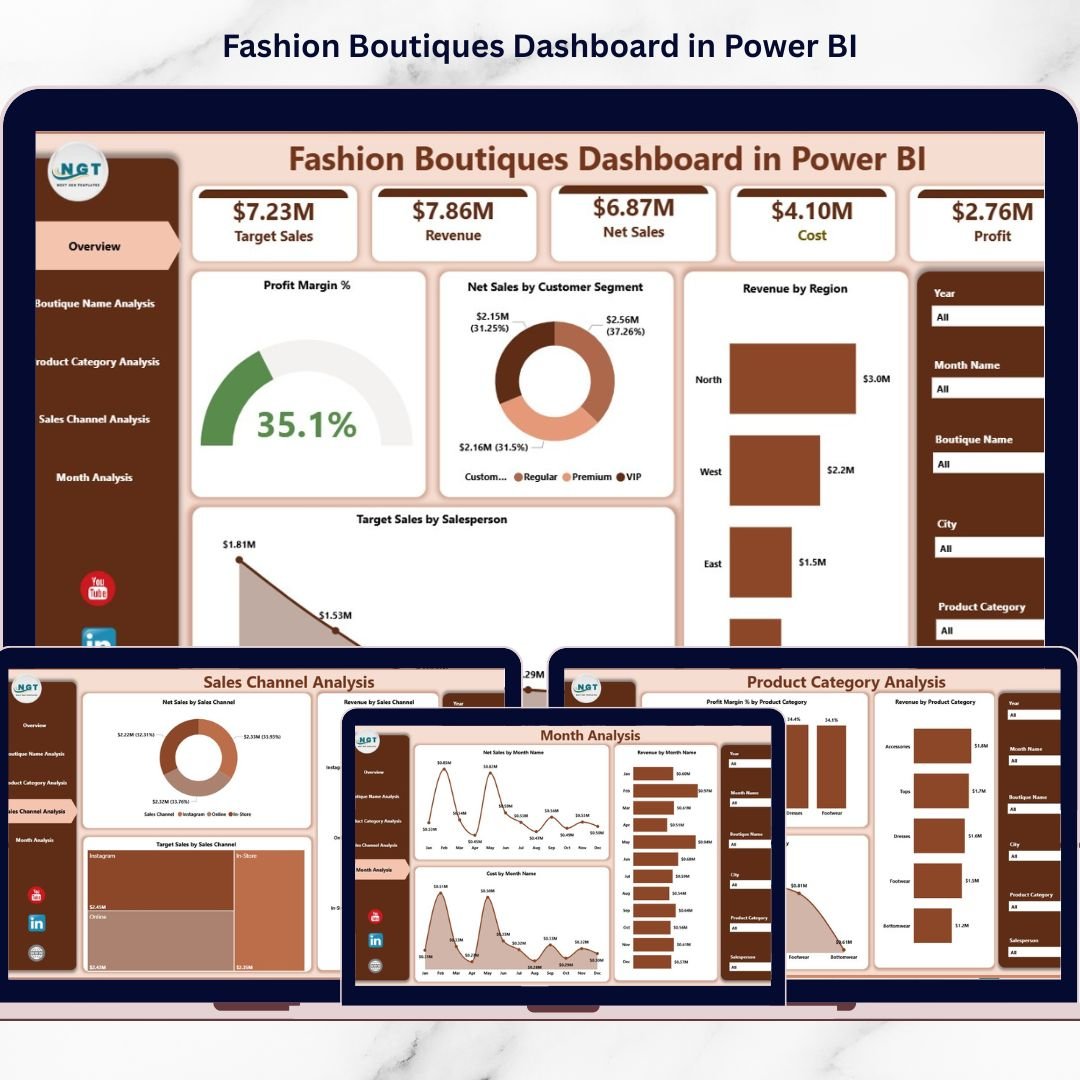
What’s Inside the Fashion Boutiques Dashboard in Power BI
This dashboard includes five powerful analytical pages, built for real retail decision-making:
📌 1) Overview Page (Complete Business Snapshot)
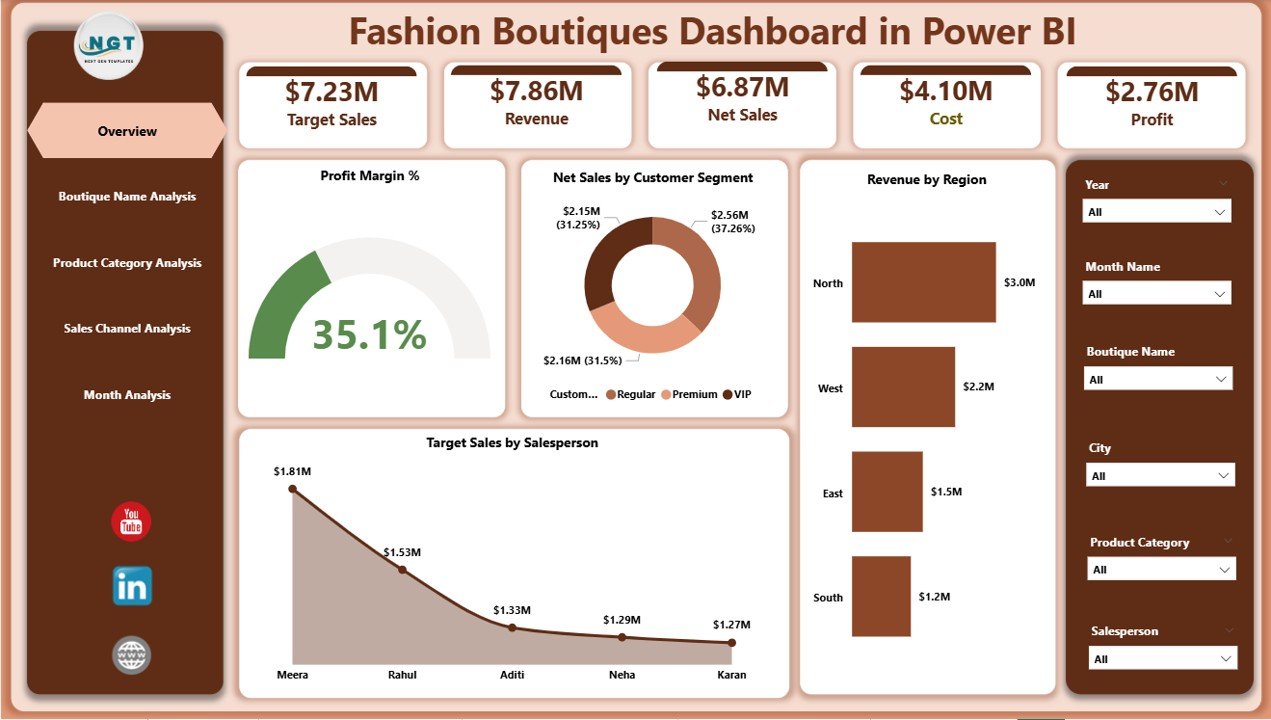
Your main control center with slicers, KPI cards, and high-impact visuals such as:
-
Profit Margin %
-
Net Sales by Customer Segment
-
Revenue by Region
-
Target Sales by Salesperson
This page answers instantly: Are we profitable? Which region performs best? Which segment drives sales? Are targets being met?
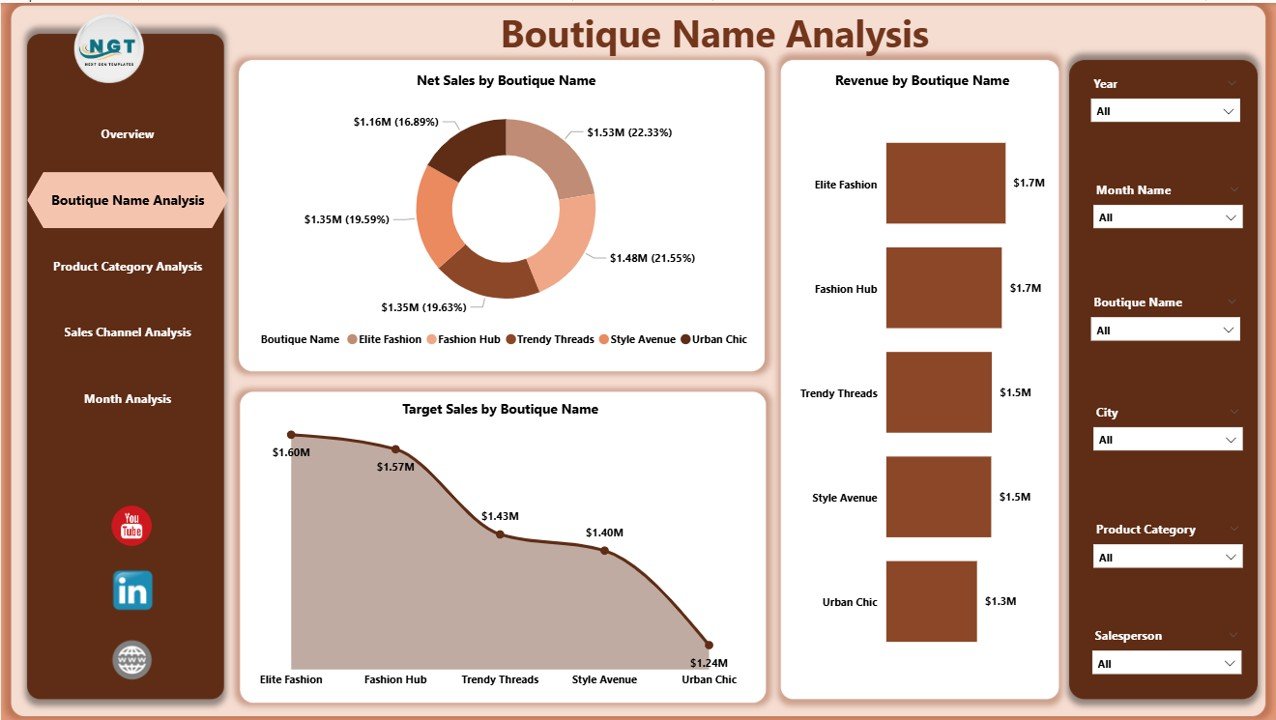
🏬 2) Boutique Name Analysis (Store Performance)
Compare boutique locations to identify top performers and problem stores using visuals like:
-
Net Sales by Boutique Name
-
Revenue by Boutique Name
-
Target Sales by Boutique Name
-
Business Value insights
Perfect for expansion planning, resource allocation, and performance accountability.
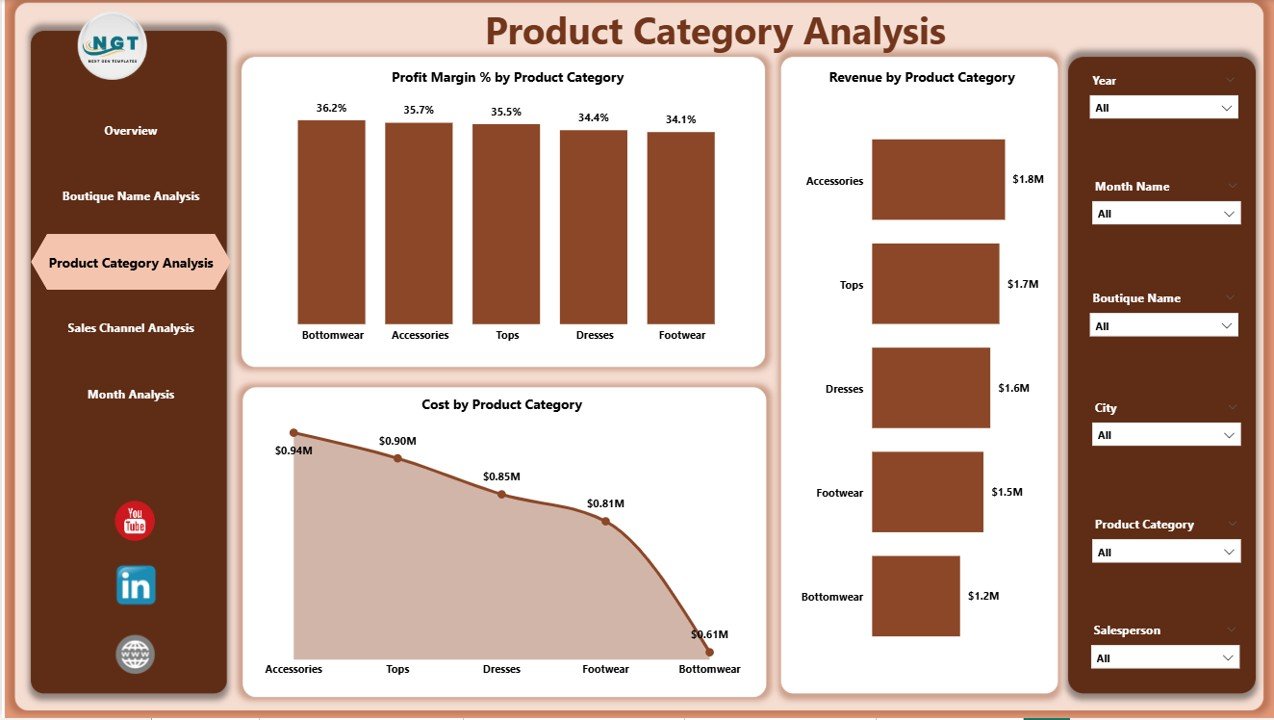
👗 3) Product Category Analysis (Profitability by Category)
Fashion success depends on category performance. This page helps you find what’s hot—and what’s hurting margins:
-
Profit Margin % by Product Category
-
Revenue by Product Category
-
Cost by Product Category
Instantly spot categories with high costs and low returns, and double down on high-margin winners.
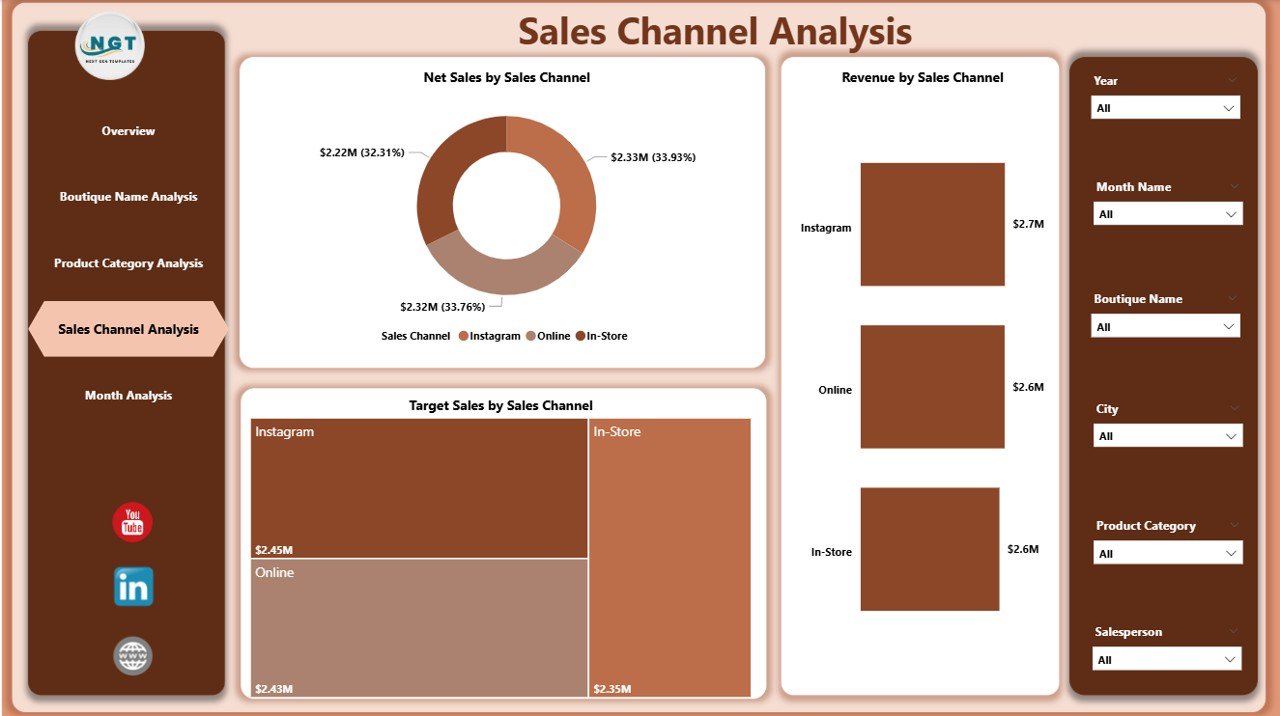
🛍️ 4) Sales Channel Analysis (Online vs Offline Performance)
Your boutique may sell through stores, websites, social media, and marketplace apps—this page shows exactly what’s working:
-
Net Sales by Sales Channel
-
Revenue by Sales Channel
-
Target Sales by Sales Channel
Use it to optimize marketing budgets, strengthen your omnichannel strategy, and focus on profitable platforms.
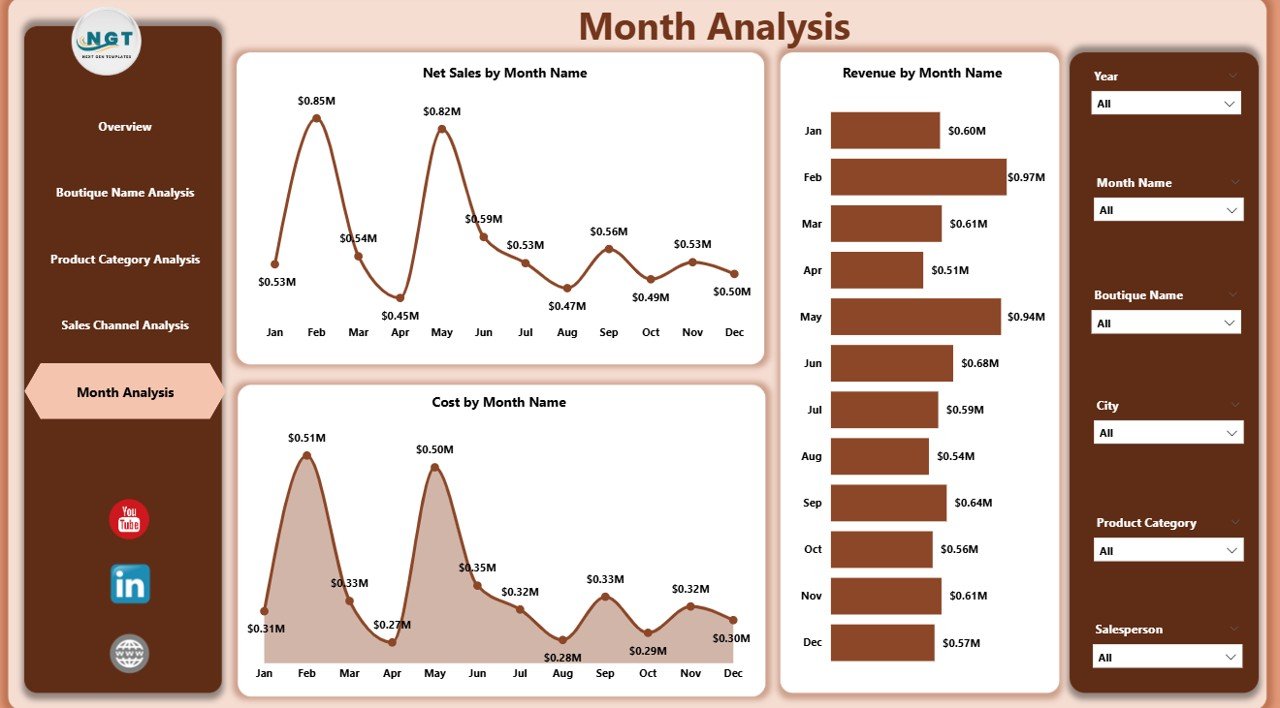
📅 5) Month Analysis (Trend & Seasonality Tracking)
Fashion is seasonal. This page reveals patterns over time so you can plan inventory and promotions smarter:
-
Net Sales by Month
-
Revenue by Month
-
Cost by Month
See peak months, slow months, and cost spikes instantly—without manual reporting.
How to Use the Fashion Boutiques Dashboard in Power BI
Getting started is simple:
1️⃣ Collect and organize boutique data (sales, cost, targets, segments, categories, etc.)
2️⃣ Load data into Power BI (Excel is a common source, but other sources work too)
3️⃣ Refresh the dashboard to update visuals automatically
4️⃣ Use slicers to filter by boutique, category, region, month, and channel
5️⃣ Track KPIs regularly and act faster using visual insights
No coding required—just filter, explore, and decide.
Who Can Benefit from This Fashion Boutiques Dashboard in Power BI
This dashboard is ideal for:
👗 Boutique Owners & Store Chains
🏬 Fashion Retail Managers
🎯 Sales Teams & Sales Leaders
📣 Marketing Analysts & Growth Teams
🛒 E-commerce Managers
📊 Retail Consultants & Analysts
💼 Finance / Profitability Teams
If you want better margins, better forecasting, and better decisions, this dashboard is built for you.
Click hare to read the Detailed blog post
Visit our YouTube channel to learn step-by-step video tutorials
Youtube.com/@PKAnExcelExpert