
The Fashion & Apparel Dashboard in Power BI is your ultimate analytics solution to track performance, profit, and customer satisfaction in one sleek, interactive platform.
In the ever-changing fashion industry, trends shift quickly — but your business decisions shouldn’t depend on guesswork. This ready-to-use Power BI dashboard turns complex fashion data into clear visuals, helping brands, retailers, and suppliers make smarter, faster, and more confident decisions.
Whether you’re analyzing production efficiency, brand profitability, or customer feedback, this dashboard gives you real-time visibility across your entire apparel business.
✨ Key Features of the Fashion & Apparel Dashboard in Power BI
✅ 📊 Overview Page – Instant Business Summary
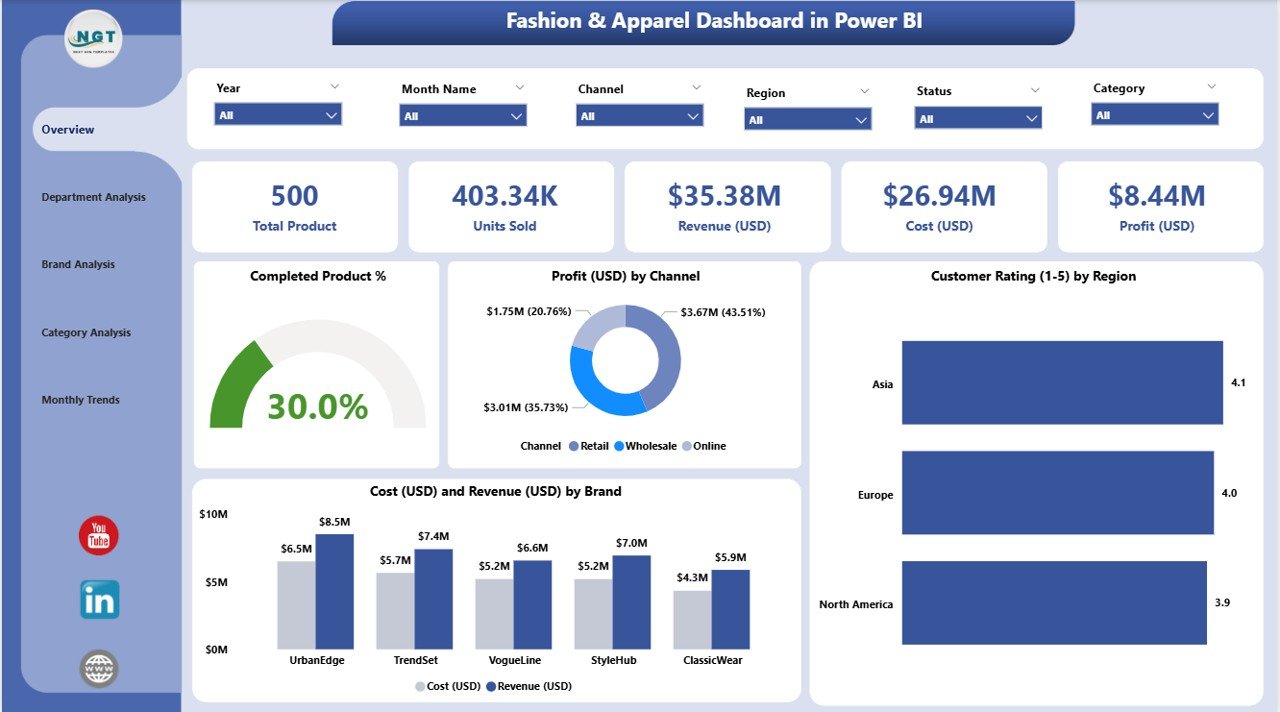
See your entire fashion business performance in one view.
-
KPI Cards: Completed Product %, Total Cost (USD), Revenue (USD), Profit (USD), and Customer Rating (1–10).
-
Charts:
-
Completed Product % for production efficiency.
-
Profit (USD) by Channel (Retail, Online, Wholesale).
-
Customer Rating (1–10) by Region.
-
Cost & Revenue (USD) by Brand.
🎯 Get an executive-level view of your company’s health in seconds.
-
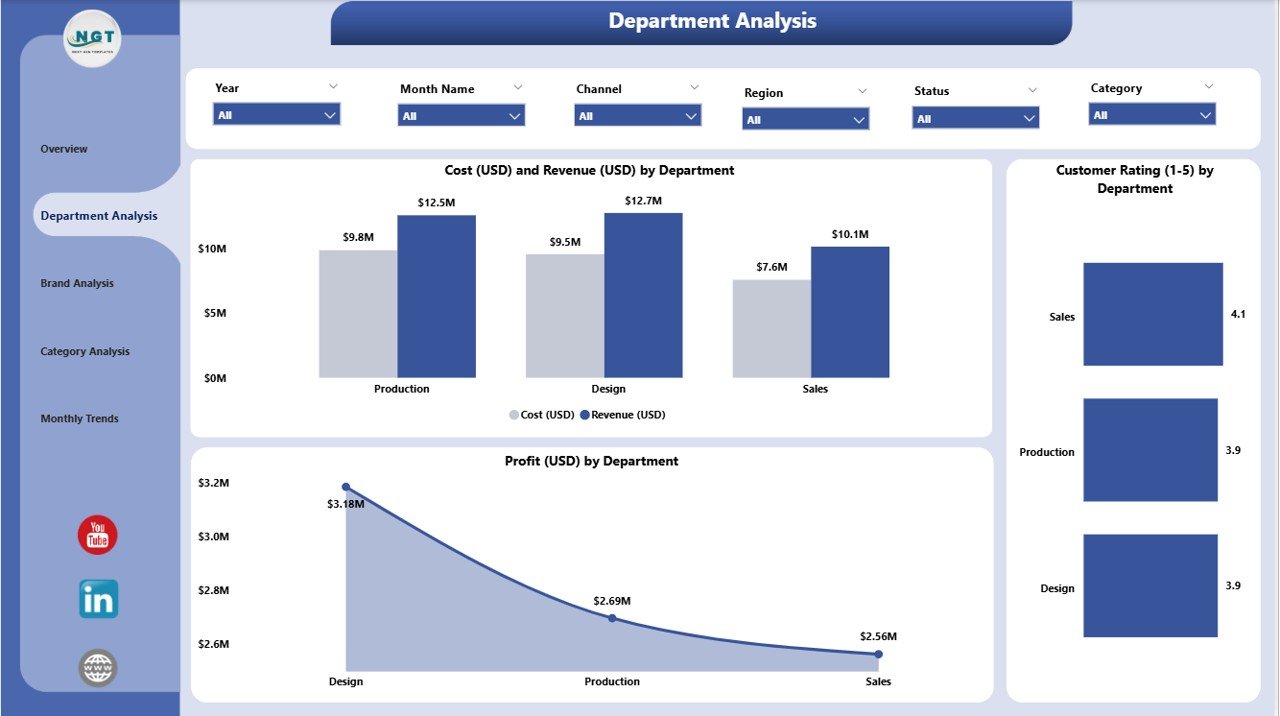
✅ 🏬 Department Analysis Page – Measure Efficiency by Department
Compare performance between departments like Design, Manufacturing, Sales, and Marketing.
-
Cost vs Revenue by Department.
-
Profit by Department.
-
Customer Rating (1–10) by Department.
💡 Identify high-performing departments and optimize areas with higher costs or lower satisfaction.
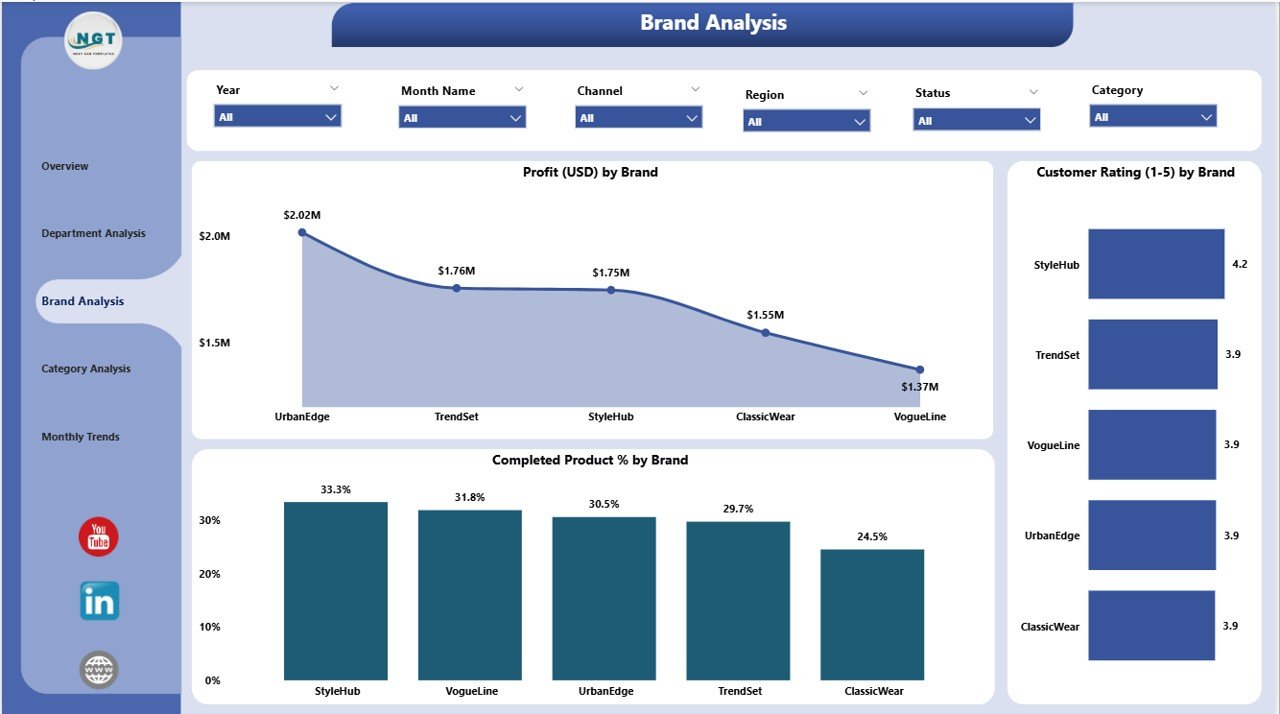
✅ 👠 Brand Analysis Page – Discover Brand-Wise Profitability
Every fashion brand has its strengths. This page reveals which ones drive growth.
-
Profit (USD) by Brand.
-
Customer Rating (1–10) by Brand.
-
Cost vs Revenue (USD) by Brand.
📈 Make smarter branding, pricing, and marketing decisions using data-backed insights.
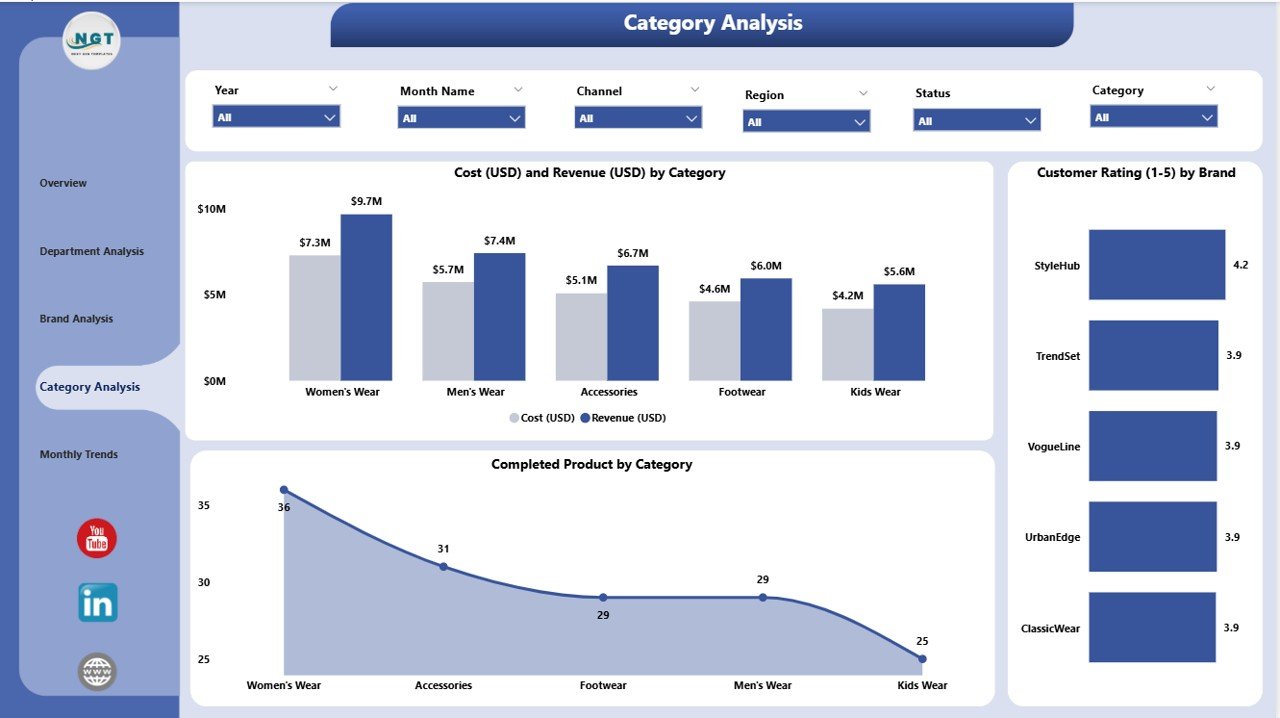
✅ 🧵 Category Analysis Page – Evaluate Product Segment Success
See which product categories shine each season.
-
Profit (USD) by Category.
-
Customer Rating (1–10) by Category.
-
Cost vs Revenue (USD) by Category.
👚 Perfect for spotting high-margin segments like casual wear, sportswear, or accessories.
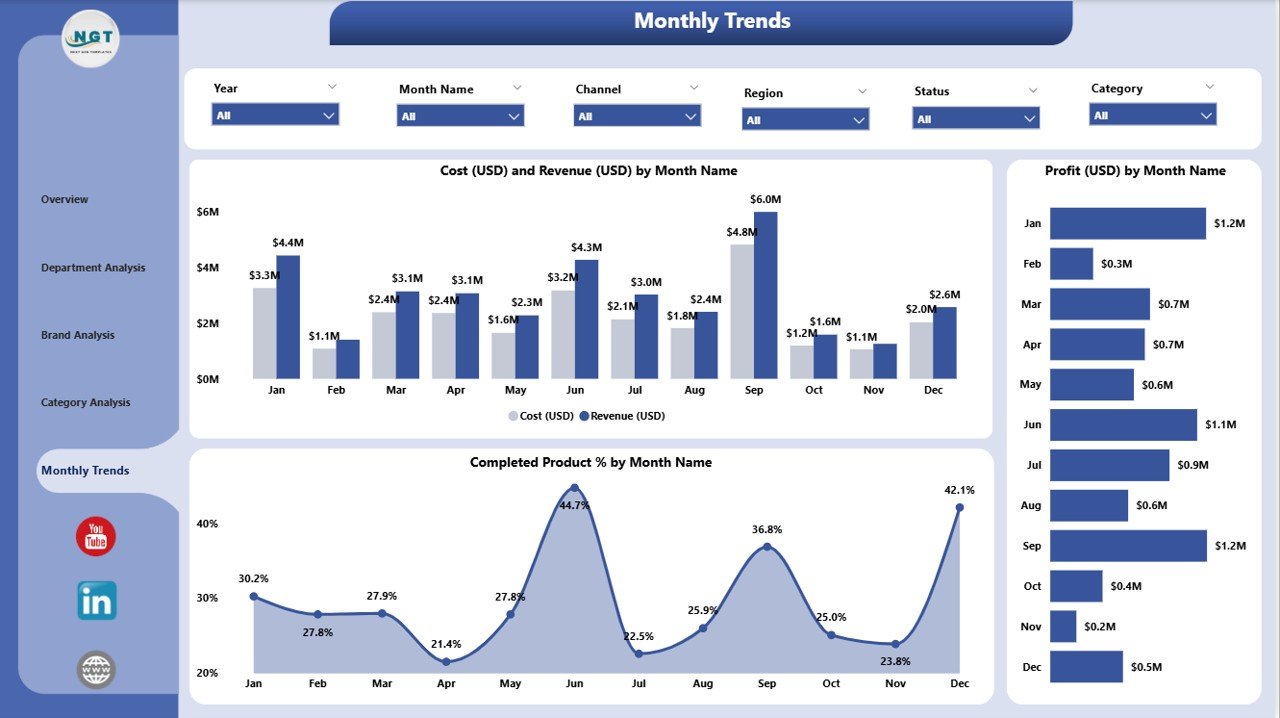
✅ 📅 Monthly Trends Page – Track Performance Over Time
Fashion runs on seasons — analyze them effectively.
-
Profit (USD) by Month.
-
Completed Product % by Month.
-
Cost vs Revenue (USD) by Month.
📊 Identify demand spikes, forecast sales, and plan inventory cycles accurately.
📦 What’s Inside the Dashboard
📁 Five Interactive Pages: Overview | Department | Brand | Category | Monthly Trends
📂 Excel-Based Data Source: Easily update daily or monthly data — Power BI refreshes automatically.
📋 Core KPIs Tracked:
-
Completed Product %
-
Cost, Revenue & Profit (USD)
-
Customer Rating (1–10)
-
Profit Margin by Channel, Brand, and Department
💡 Every metric refreshes in real-time with slicers and filters for deeper exploration.
⚙️ How to Use the Dashboard
1️⃣ Connect your Excel or ERP data to Power BI.
2️⃣ Refresh your dataset — visuals update instantly.
3️⃣ Use slicers to filter by Region, Brand, or Category.
4️⃣ Review trends across all five pages.
5️⃣ Export visuals or share reports securely via Power BI Service.
🚀 No coding needed — just insights at a glance.
👥 Who Can Benefit from This Dashboard
👗 Fashion Retailers & Brands – Track sales, margins, and customer satisfaction.
🏭 Manufacturers & Suppliers – Analyze production completion rates and costs.
🧾 Finance Teams – Monitor profitability and expense ratios.
🛒 Marketing Managers – Identify top-performing channels and campaigns.
👠 Executives & Decision-Makers – Gain a 360° overview of operations and growth.
This Power BI dashboard is perfect for boutique labels, large fashion chains, apparel distributors, and garment manufacturers.
💡 Advantages of the Fashion & Apparel Dashboard in Power BI
✅ Centralized Data View – Consolidate sales, production, and cost metrics in one place.
✅ Real-Time Insights – Monitor performance live with automatic data refresh.
✅ Interactive Visuals – Drill down into departments, brands, and categories.
✅ Scalable Design – Add more KPIs or regions as your business grows.
✅ AI-Driven Forecasting – Predict demand and optimize production.
✅ User-Friendly Interface – Ideal for both analysts and business users.
📈 Turn scattered fashion data into actionable intelligence with just a few clicks.


Reviews
There are no reviews yet.