

Managing facility services in today’s fast-moving environment is a complex challenge. Facility managers constantly deal with delayed services, rising maintenance costs, customer complaints, and limited visibility into real performance. When decisions depend on scattered spreadsheets or static reports, issues remain hidden until they escalate. That is exactly why the Facility Services Dashboard in Power BI is a game-changing solution.
This ready-to-use Power BI dashboard transforms raw facility service data into clear, interactive, and decision-ready insights. Instead of reacting to problems, facility teams gain the ability to monitor performance in real time, identify risks early, and take proactive actions. Built with simplicity and usability in mind, this dashboard helps organizations manage facility services with confidence and control.
🚀 Key Features of Facility Services Dashboard in Power BI
📌 Centralized Facility Performance View
Monitor all critical facility service KPIs—delays, completion hours, service cost, priority services, and satisfaction—in one place.
📊 Interactive Power BI Visuals
Dynamic charts, KPI cards, and slicers update instantly based on selected facility, region, service type, or month.
⏱️ Service Delay & SLA Monitoring
Identify delayed services quickly and understand where SLA breaches occur.
💰 Service Cost Transparency
Analyze service cost distribution by service type, facility type, region, and time.
🔥 Priority Service Tracking
Track high-priority service volumes to reduce operational risk and downtime.
📆 Trend & Pattern Analysis
Understand monthly trends to improve planning, staffing, and budgeting.
🧭 Decision-Focused Page Design
Each dashboard page is designed to answer specific operational and strategic questions.
📂 What’s Inside the Facility Services Dashboard in Power BI
This professionally designed Power BI file includes five focused analytical pages, each serving a unique purpose:
📌 Overview Page
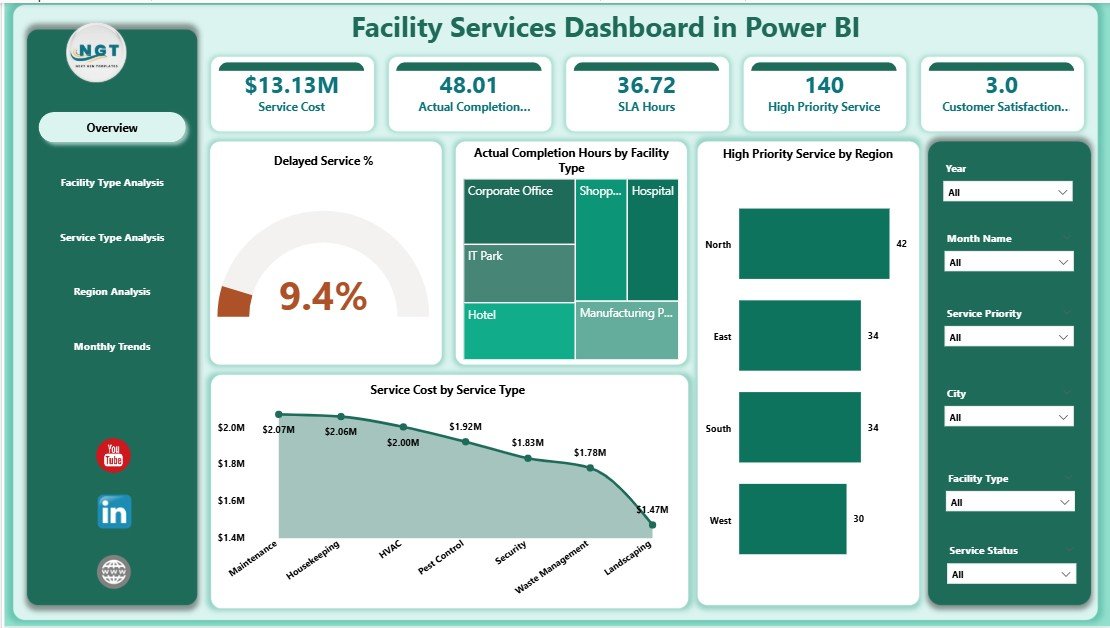
• KPI Cards for delayed service %, completion hours, priority services, and service cost
• Interactive slicers for facility, region, service type, and month
• High-level snapshot of overall facility service health
🏢 Facility Type Analysis Page
• High Priority Service by Facility Type
• Customer Satisfaction Rating by Facility Type
• Service Cost by Facility Type
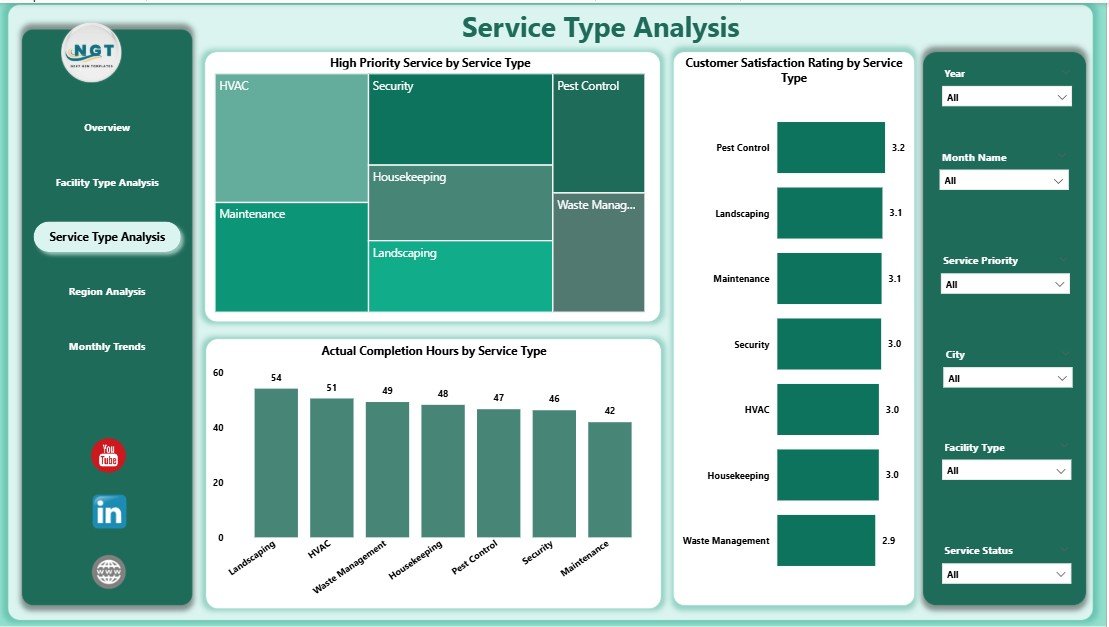
🛠️ Service Type Analysis Page
• High Priority Service by Service Type
• Customer Satisfaction by Service Type
• Actual Completion Hours by Service Type
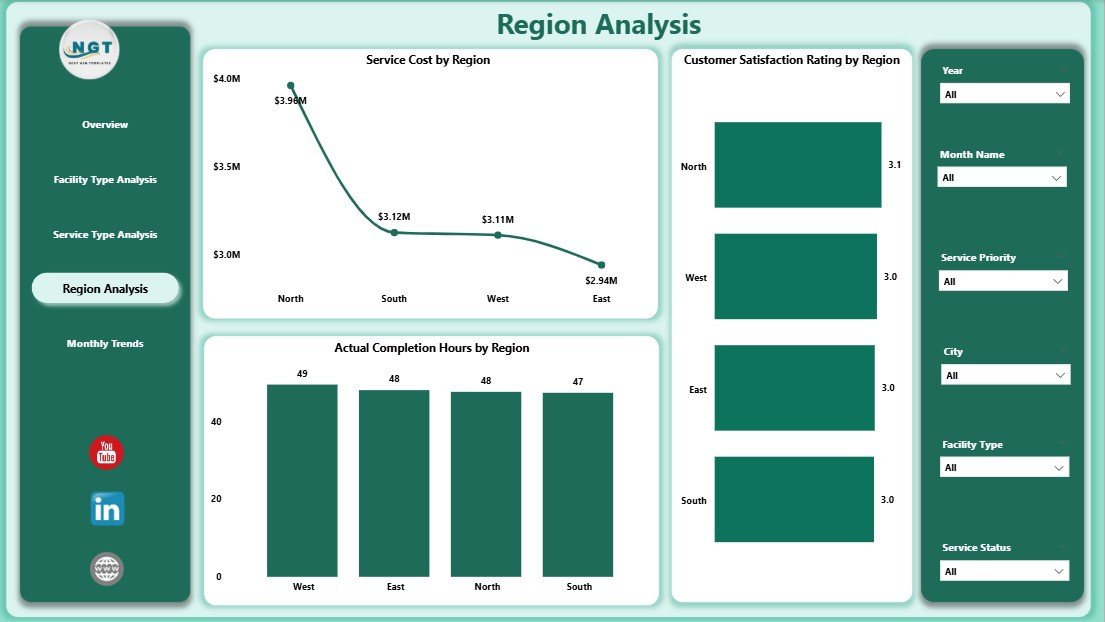
🌍 Region Analysis Page
• Service Cost by Region
• Actual Completion Hours by Region
• Customer Satisfaction Rating by Region
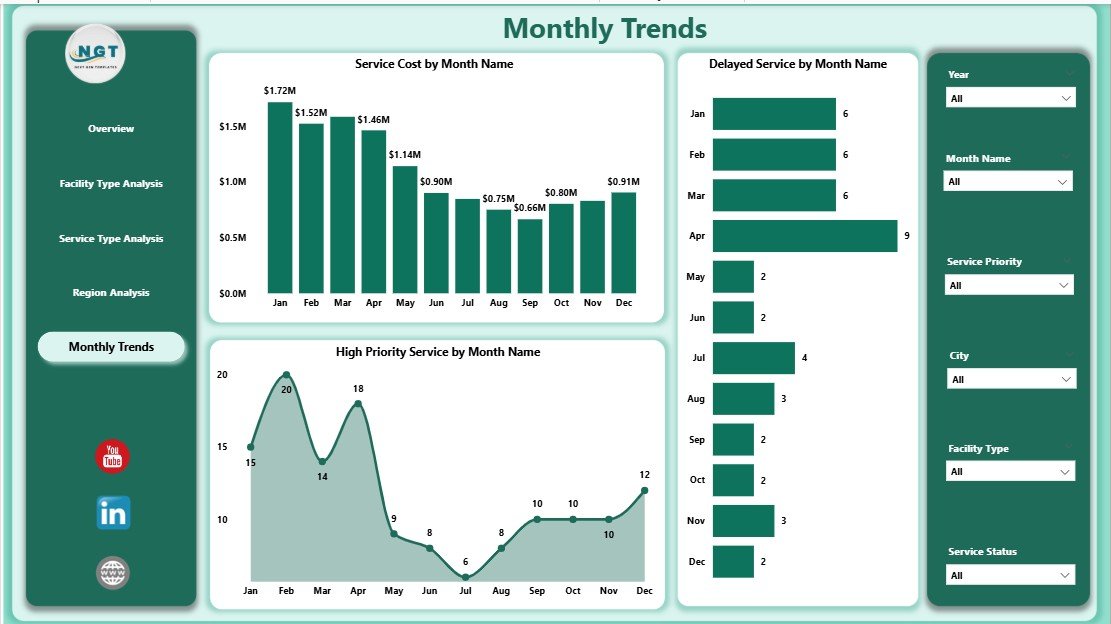
📆 Month Analysis Page
• Service Cost Trend by Month
• Delayed Service % by Month
• High Priority Service Trend by Month
Together, these pages give a 360-degree view of facility service operations.
🛠️ How to Use the Facility Services Dashboard in Power BI
1️⃣ Connect the dashboard to your facility service data (Excel, database, or system export)
2️⃣ Refresh the dataset in Power BI
3️⃣ Use slicers to filter data by facility, service type, region, or month
4️⃣ Review KPI cards and charts to identify risks, delays, and cost issues
5️⃣ Share insights with stakeholders and take action
No advanced Power BI expertise is required. The dashboard is designed for easy adoption by both technical and non-technical users.
👥 Who Can Benefit from This Facility Services Dashboard
🏢 Facility Managers
🛠️ Maintenance & Operations Teams
📋 Service Coordinators
🌍 Regional & Area Managers
💰 Finance & Cost Control Teams
👔 Senior Leadership & Executives
Any organization managing multiple facilities, services, and regions will benefit from this dashboard.
🔗 Click here to read the Detailed blog post
▶️ Visit our YouTube channel to learn step-by-step video tutorials
Visit our YouTube channel to learn step-by-step video tutorials


Reviews
There are no reviews yet.