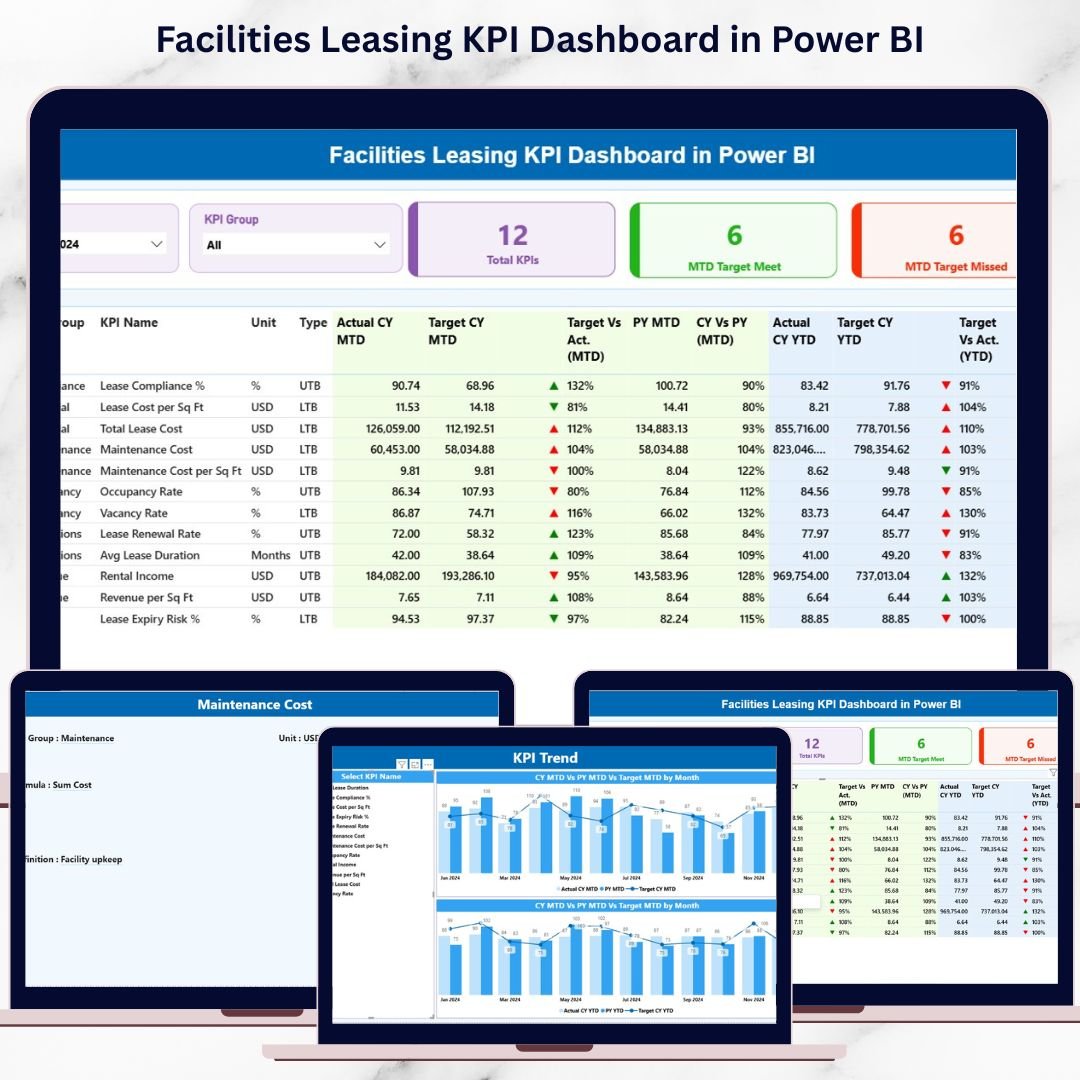
Managing facilities leasing without clear visibility often results in rising costs, missed renewals, and inefficient space utilization. When leasing data stays scattered across spreadsheets and reports, decision-making becomes reactive instead of strategic. That is exactly why the Facilities Leasing KPI Dashboard in Power BI is designed to transform how organizations monitor, analyze, and optimize leasing performance.
This ready-to-use Power BI dashboard converts complex leasing data into clear, actionable insights. Instead of spending hours on manual reporting, you gain one centralized view of MTD, YTD, targets, and historical trends—all in a professional, interactive Power BI report. As a result, facility managers, finance teams, and leadership gain clarity, control, and confidence in every leasing decision.
🔑 Key Features of Facilities Leasing KPI Dashboard in Power BI
📊 Centralized Leasing Performance View
Track all critical facilities leasing KPIs in one interactive Power BI dashboard without switching between multiple files.
📅 MTD & YTD Performance Tracking
Monitor Month-to-Date and Year-to-Date actuals, targets, and previous year comparisons in real time.
🎯 Target Achievement Monitoring
Instantly identify KPIs that meet targets and those that miss targets using dynamic cards and visual indicators.
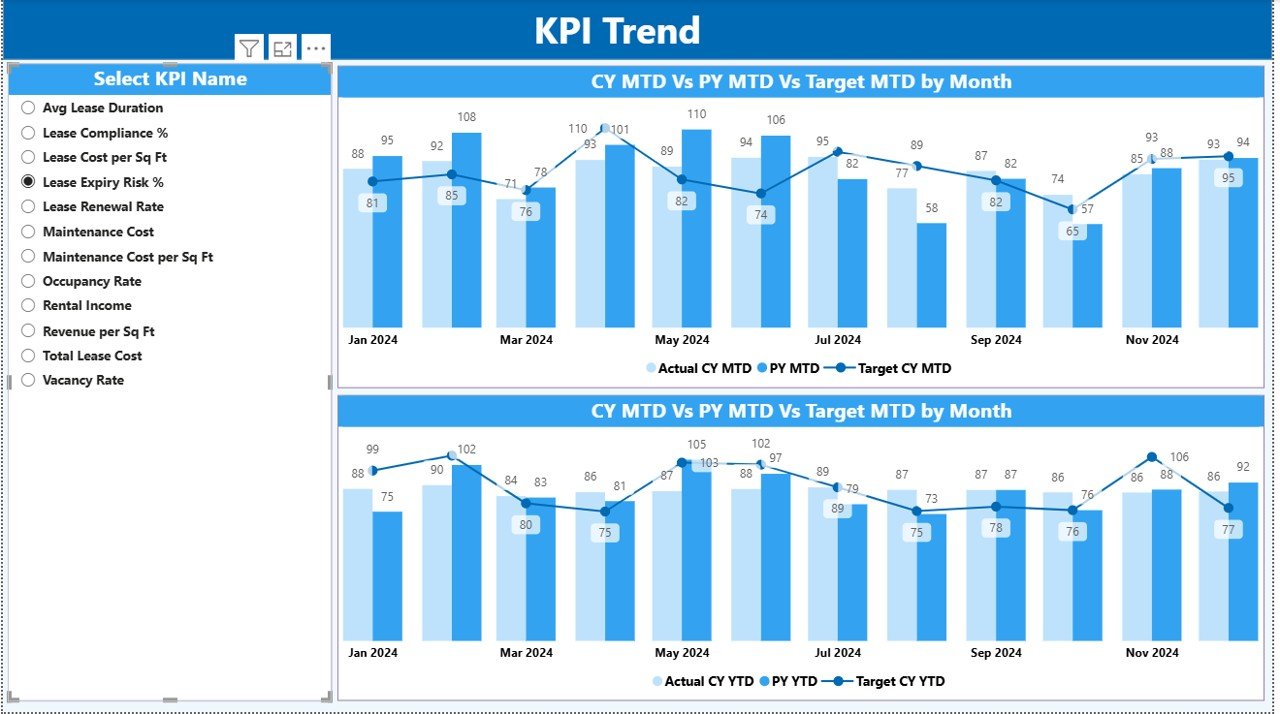
📈 KPI Trend Analysis
Analyze historical performance using combo charts that compare Actual vs Target vs Previous Year trends.
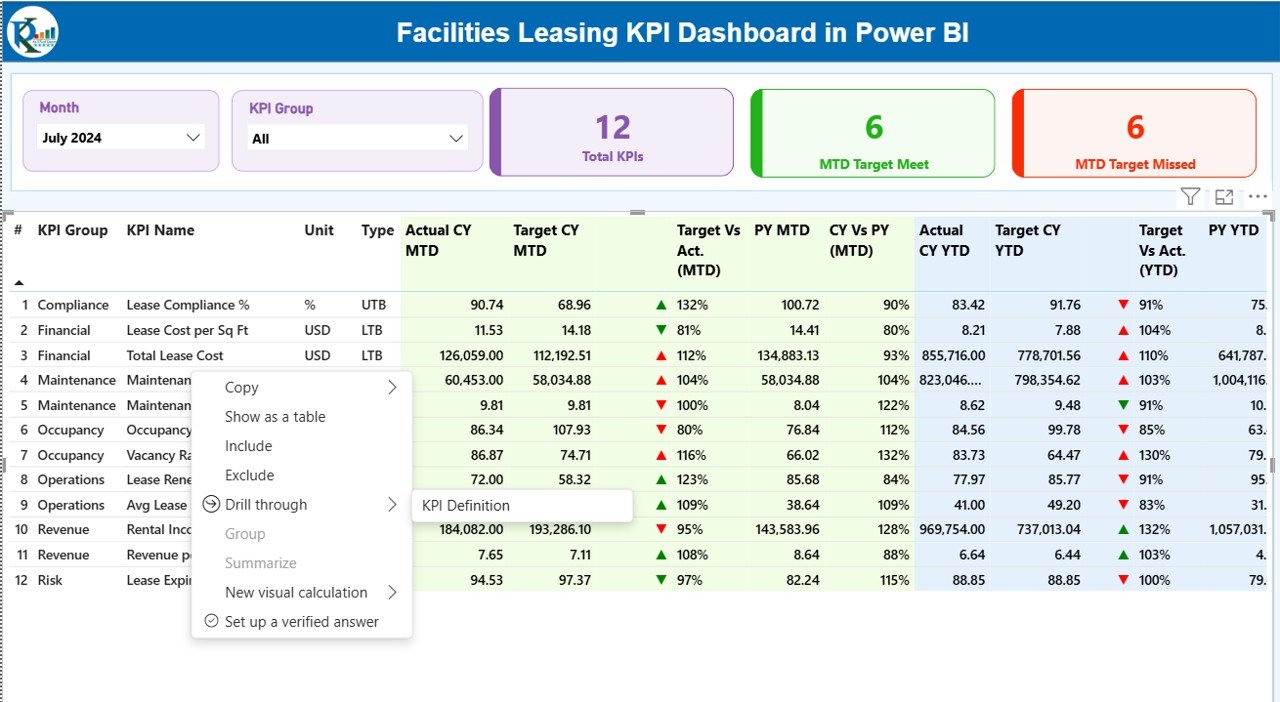
🔍 Drill-Through KPI Definitions
Right-click on any KPI to view its definition, formula, and logic without cluttering the main dashboard.
🧮 LTB & UTB KPI Logic
Clearly distinguish between Lower-the-Better and Upper-the-Better KPIs for accurate performance evaluation.
⚡ Excel-Driven & Easy to Update
Simply update the Excel input file and refresh Power BI—no advanced technical skills required.
📦 What’s Inside the Facilities Leasing KPI Dashboard
This Power BI file includes three professionally designed pages, each serving a specific analytical purpose:
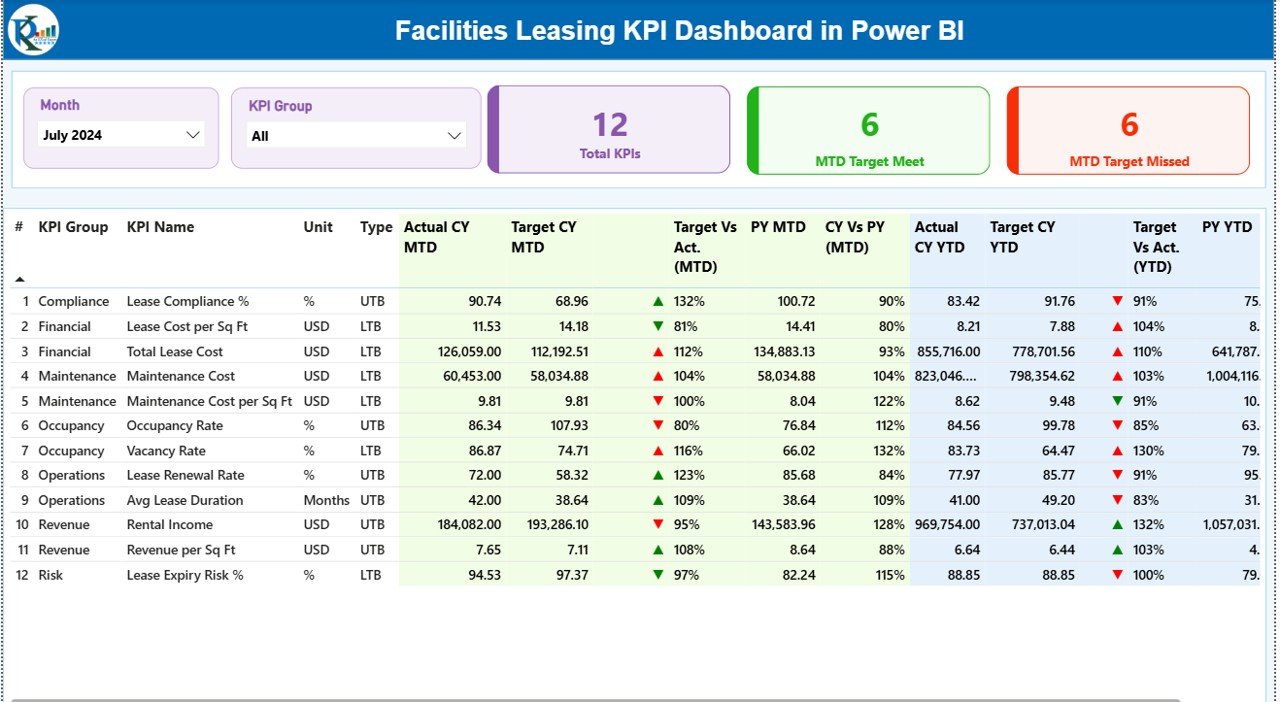
📌 Summary Page
The command center of the dashboard showing:
-
Month and KPI Group slicers
-
Total KPIs count
-
MTD Target Met and Missed KPIs
-
Detailed KPI table with MTD & YTD Actuals, Targets, Previous Year values, and performance indicators
📌 KPI Trend Page
Focused on historical performance analysis:
-
MTD Actual vs Target vs Previous Year combo chart
-
YTD Actual vs Target vs Previous Year combo chart
-
KPI slicer to analyze individual KPIs
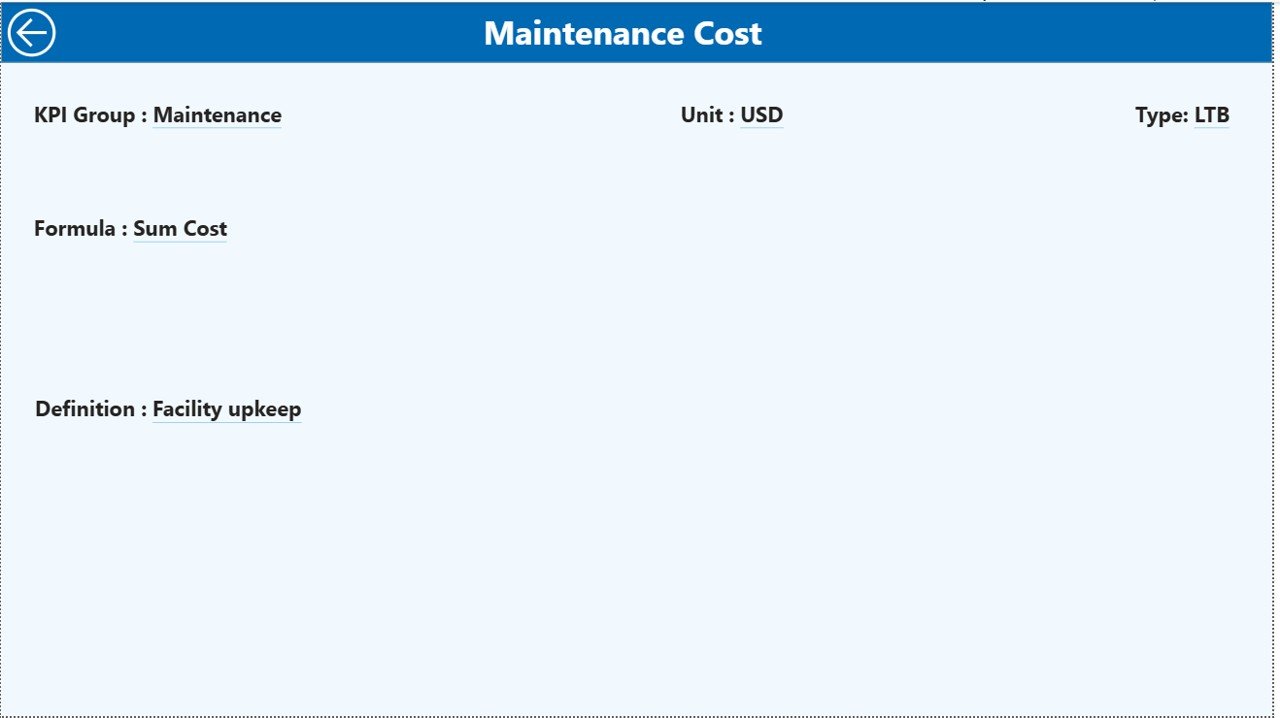
📌 KPI Definition Page
A dedicated drill-through page that explains:
-
KPI meaning
-
Formula
-
Unit of measurement
-
LTB / UTB logic
In addition, the dashboard connects to a structured Excel file with:
-
Input_Actual Sheet
-
Input_Target Sheet
-
KPI Definition Sheet
This structure ensures smooth refreshes and scalable data management.
🛠️ How to Use the Facilities Leasing KPI Dashboard
🚀 Step 1: Enter actual leasing data in the Input_Actual Excel sheet
🎯 Step 2: Update target values in the Input_Target sheet
📘 Step 3: Maintain KPI logic in the KPI Definition sheet
🔄 Step 4: Open Power BI Desktop and refresh the data
📊 Step 5: Use slicers, drill-through, and visuals to analyze performance
Because the dashboard is designed with simplicity in mind, even beginners can start using it immediately.
🎯 Who Can Benefit from This Facilities Leasing KPI Dashboard?
🏢 Facility Managers – Track lease performance and utilization
🏗️ Real Estate & Leasing Teams – Monitor KPIs across locations
💰 Finance & Accounting Teams – Control leasing costs and targets
📈 Operations Managers – Improve planning and efficiency
👔 Senior Leadership – Make data-driven leasing decisions
If your organization manages multiple facilities or leases, this dashboard becomes an essential performance management tool.


Reviews
There are no reviews yet.