Modern event management is no longer driven by intuition alone. Today’s event organizers must evaluate budgets, attendance, engagement levels, marketing effectiveness, and overall event success using measurable data. However, many event teams still rely on scattered spreadsheets and manual reporting methods, making performance evaluation slow and inconsistent.
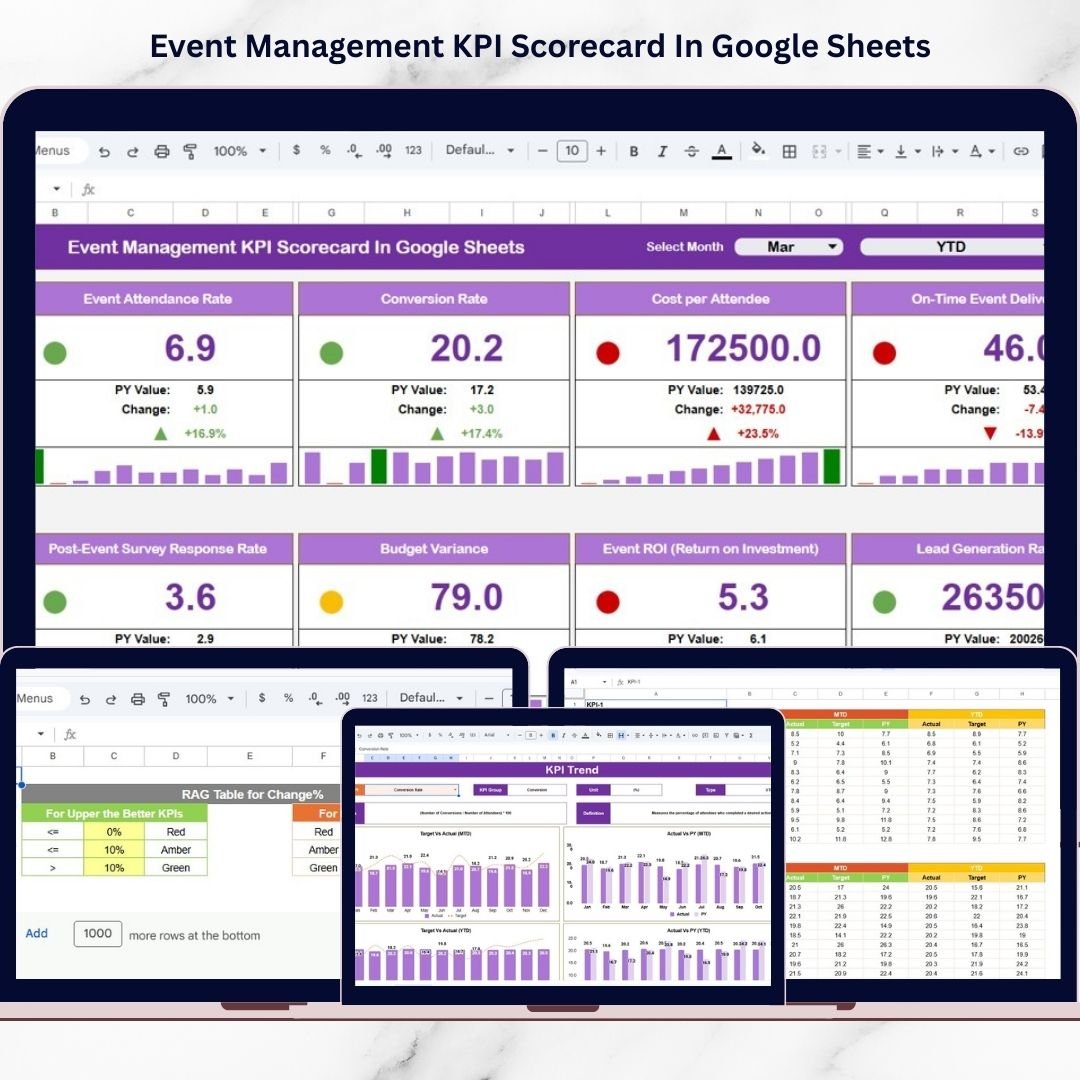
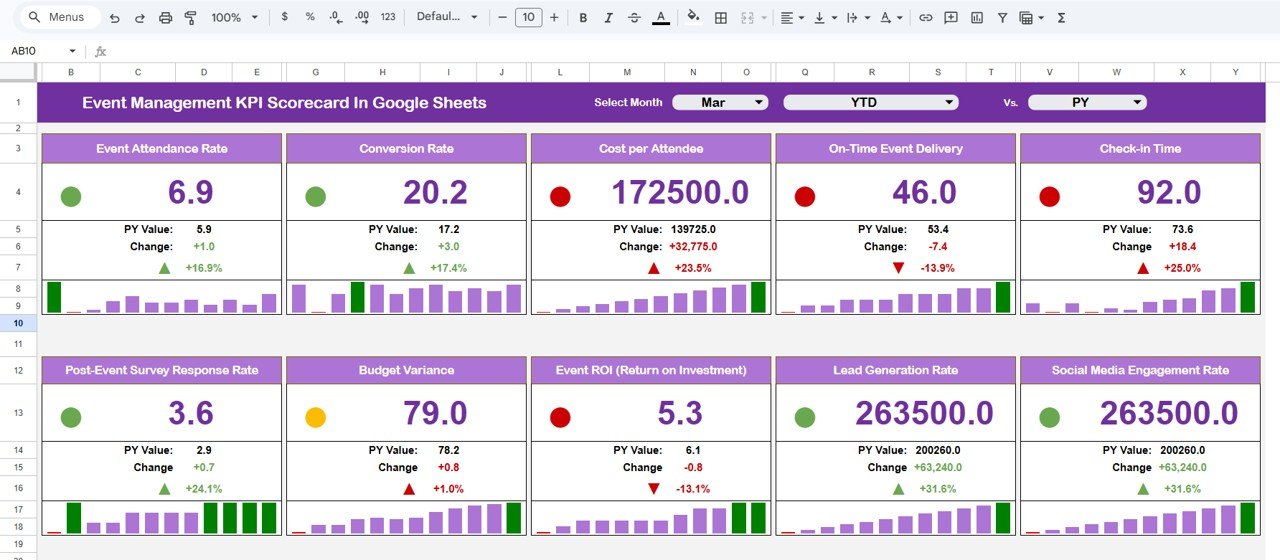
The Event Management KPI Scorecard in Google Sheets is a powerful, ready-to-use performance monitoring solution designed to help organizers track event success using structured Key Performance Indicators (KPIs). Built entirely in Google Sheets, this interactive scorecard transforms raw event data into clear visual insights, enabling teams to evaluate performance quickly and make smarter decisions.
Instead of reviewing multiple reports, users can monitor all important event metrics from a centralized dashboard. Because Google Sheets operates in the cloud, teams can collaborate in real time, update performance data instantly, and access analytics from anywhere. 🎯📊
This scorecard combines automated calculations, performance indicators, and trend analysis to provide both short-term and long-term insights. With built-in MTD (Month-to-Date) and YTD (Year-to-Date) analysis modes, organizations can evaluate individual event performance while also understanding yearly progress.
Whether managing corporate conferences, marketing events, training programs, or nonprofit campaigns, this KPI scorecard helps teams measure outcomes objectively and continuously improve event strategies.
## Key Features of Event Management KPI Scorecard in Google Sheets
📊 Centralized KPI Dashboard – Monitor 10 event performance KPIs from one interactive scorecard.
📅 Monthly Selection Dropdown – Instantly analyze performance for any selected month.
📈 MTD & YTD Analysis Modes – Compare monthly and yearly performance automatically.
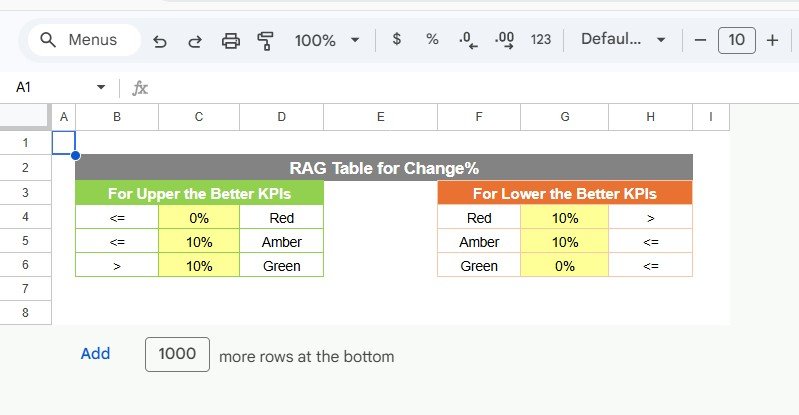
🚦 Traffic Light Indicators – Visual status signals highlight KPI performance instantly.
🔺 Performance Trend Arrows – Identify improvements or declines quickly.
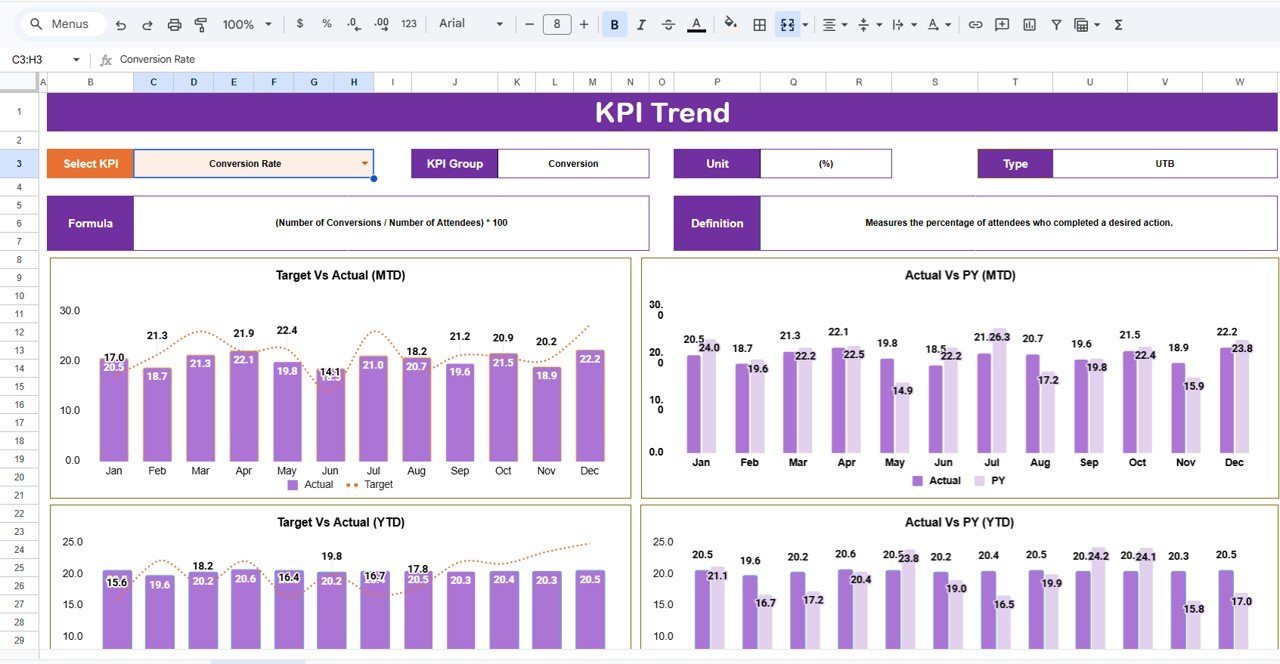
📉 Dynamic KPI Trend Analysis – Visualize performance evolution over time.
📂 Automated Data Updates – Dashboard refreshes automatically after data entry.
☁️ Cloud Collaboration – Multiple users can work simultaneously in Google Sheets.
These features convert Google Sheets into a powerful event analytics platform.
## What’s Inside the Event Management KPI Scorecard in Google Sheets
This ready-to-use template includes structured worksheets designed for complete performance tracking:
✅ Scorecard Sheet – Main dashboard showing KPI results with traffic-light indicators and comparisons.
✅ Trend Sheet – Detailed KPI trend analysis with selectable KPI insights.
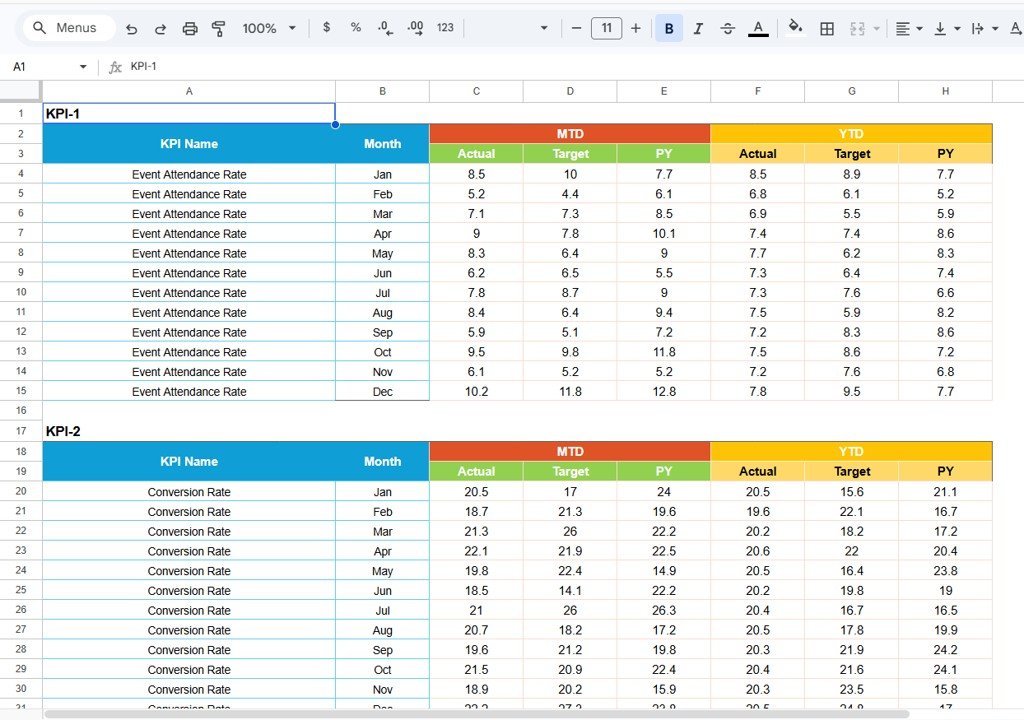
✅ Data Input Sheet – Central location for entering attendance, revenue, costs, and engagement data.
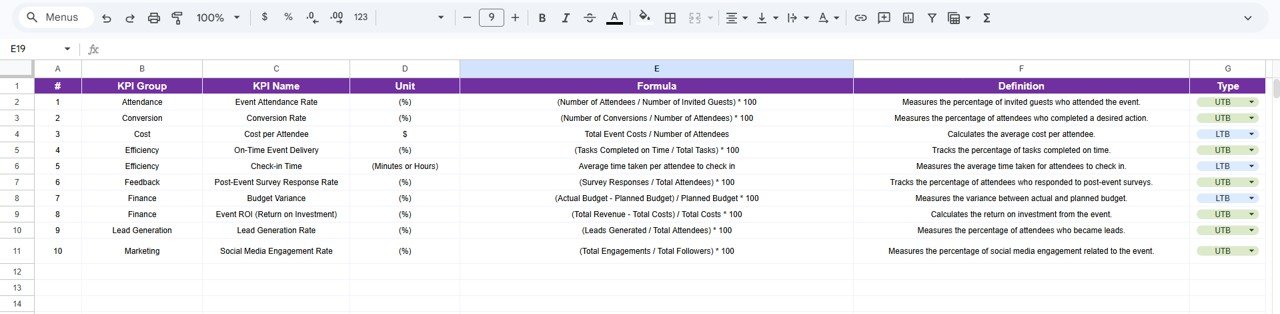
✅ KPI Definition Sheet – Repository defining KPI formulas, units, and classifications.
✅ Color Settings Section – Customize performance thresholds and dashboard visuals.
Together, these components create a professional event performance monitoring system.
## How to Use the Event Management KPI Scorecard in Google Sheets
Using the scorecard is simple and beginner-friendly:
1️⃣ Enter event performance data in the Data Input Sheet.
2️⃣ Select the reporting month using the dropdown menu.
3️⃣ Choose MTD or YTD analysis mode.
4️⃣ Review KPI performance indicators on the dashboard.
5️⃣ Analyze trends using the Trend Sheet.
6️⃣ Adjust event strategies based on insights.
Within minutes, teams can start measuring event performance effectively.
## Who Can Benefit from This Event Management KPI Scorecard in Google Sheets
This template is ideal for:
🎤 Event managers and coordinators
📣 Marketing and campaign teams
🏢 Corporate event planners
🎓 Training and workshop organizers
🤝 Nonprofit event coordinators
📊 Business analysts and performance teams
From small events to large conferences, any organization managing events can benefit from structured KPI tracking.
A KPI-driven approach transforms event management from guesswork into measurable success. By combining automated analytics, visual indicators, and centralized reporting, the Event Management KPI Scorecard in Google Sheets helps organizations improve planning accuracy, enhance attendee experiences, and optimize event outcomes.
Instead of analyzing results after problems occur, teams gain proactive insights that lead to smarter event strategies and continuous improvement. ✅
### Click here to read the Detailed blog post
Watch the step-by-step video tutorial:
Visit our YouTube channel to learn step-by-step video tutorials:
👉 YouTube.com/@NeotechNavigators