
🔑 Key Features of Etsy Seller Analytics Dashboard in Power BI
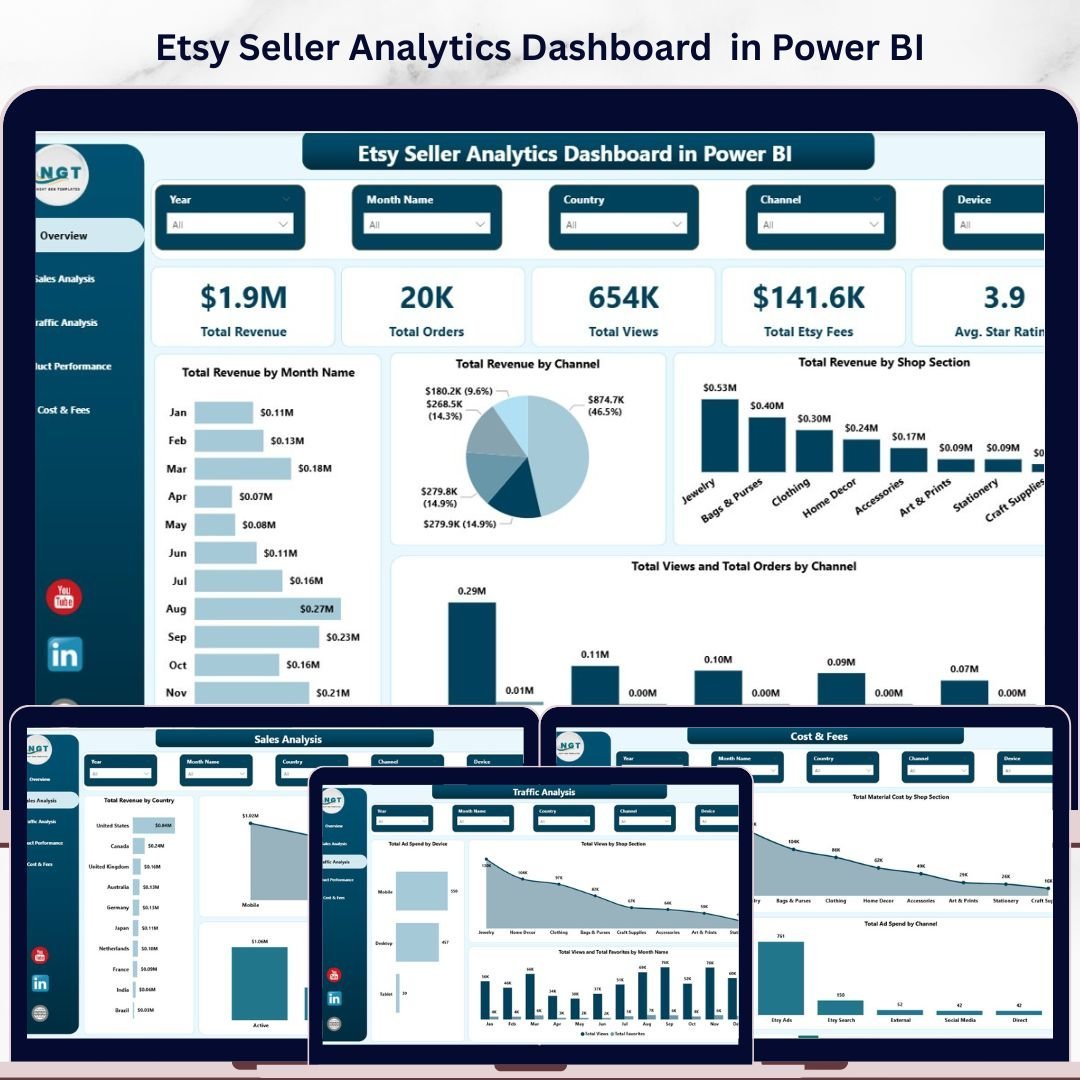
Etsy Seller Analytics Dashboard in Power BI is a professionally designed, interactive analytics template built specifically for Etsy shop owners who want to monitor revenue, orders, traffic, product performance, advertising costs, and customer ratings — all from a single dynamic Power BI dashboard. This template includes 5 interactive dashboard pages covering Overview, Sales Analysis, Traffic Analysis, Product Performance, and Cost and Fees, delivering a complete 360-degree view of your Etsy shop business 🚀.
Whether you sell handmade products, vintage items, or digital downloads on Etsy, this Power BI Dashboard Template transforms your raw Etsy data into actionable visual insights instantly. Simply open the .pbix file in Power BI Desktop, connect your data source, and refresh — all charts, KPI cards, and filters update automatically. This Etsy Seller Analytics Dashboard in Power BI tracks 5 key performance indicators on the Overview page including Total Revenue, Total Orders, Total Views, Total Etsy Fees, and Avg. Star Rating, with 12+ charts and visualizations spread across 5 dashboard pages.
If you prefer working in Excel, check out the Etsy Seller Analytics Dashboard in Excel for pivot-powered analytics. Also explore our Amazon FBA Seller Dashboard in Power BI and Online Marketplaces Dashboard in Excel for complementary e-commerce analytics.
📦 What’s Inside the Etsy Seller Analytics Dashboard in Power BI
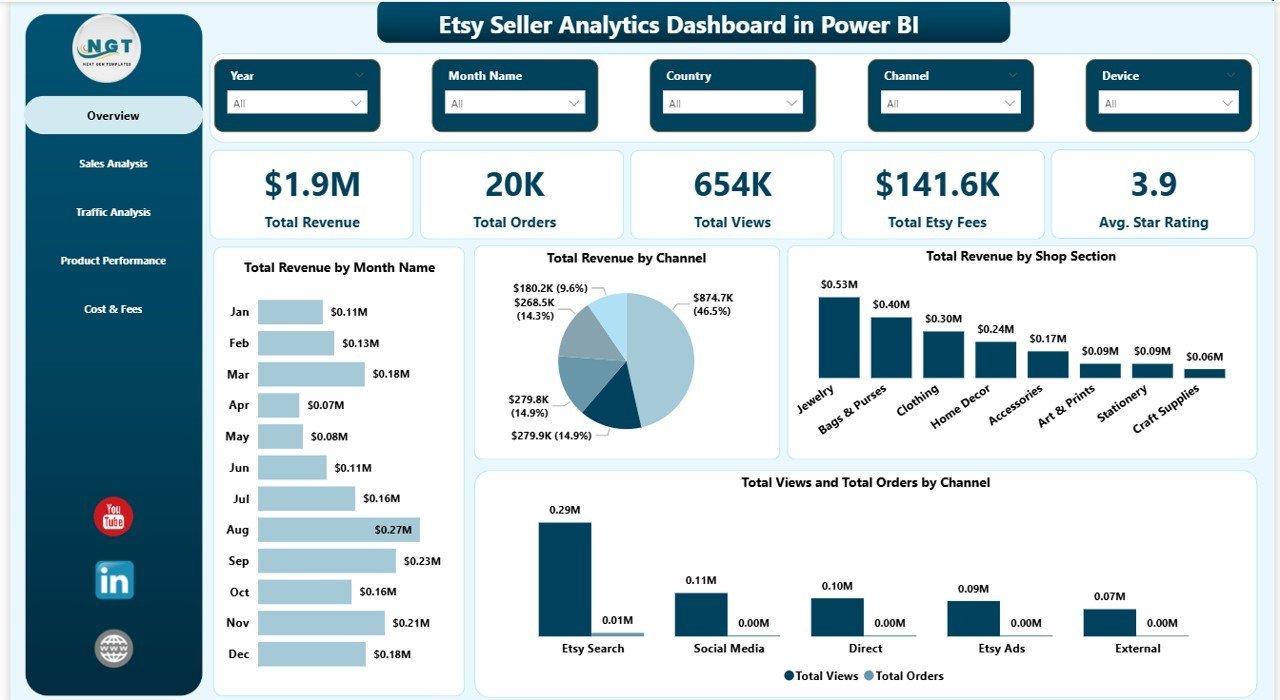
📌 Overview Page — High-level KPI cards showing Total Revenue, Total Orders, Total Views, Total Etsy Fees, and Avg. Star Rating. Interactive charts display Total Revenue by Month Name tracking monthly revenue trends, Total Revenue by Channel comparing earnings across different sales channels, Total Revenue by Shop Section analyzing revenue distribution by product sections, and Total Views and Total Orders by Channel comparing traffic and conversion performance. Multiple slicers allow instant filtering across all dimensions.

Overview Page
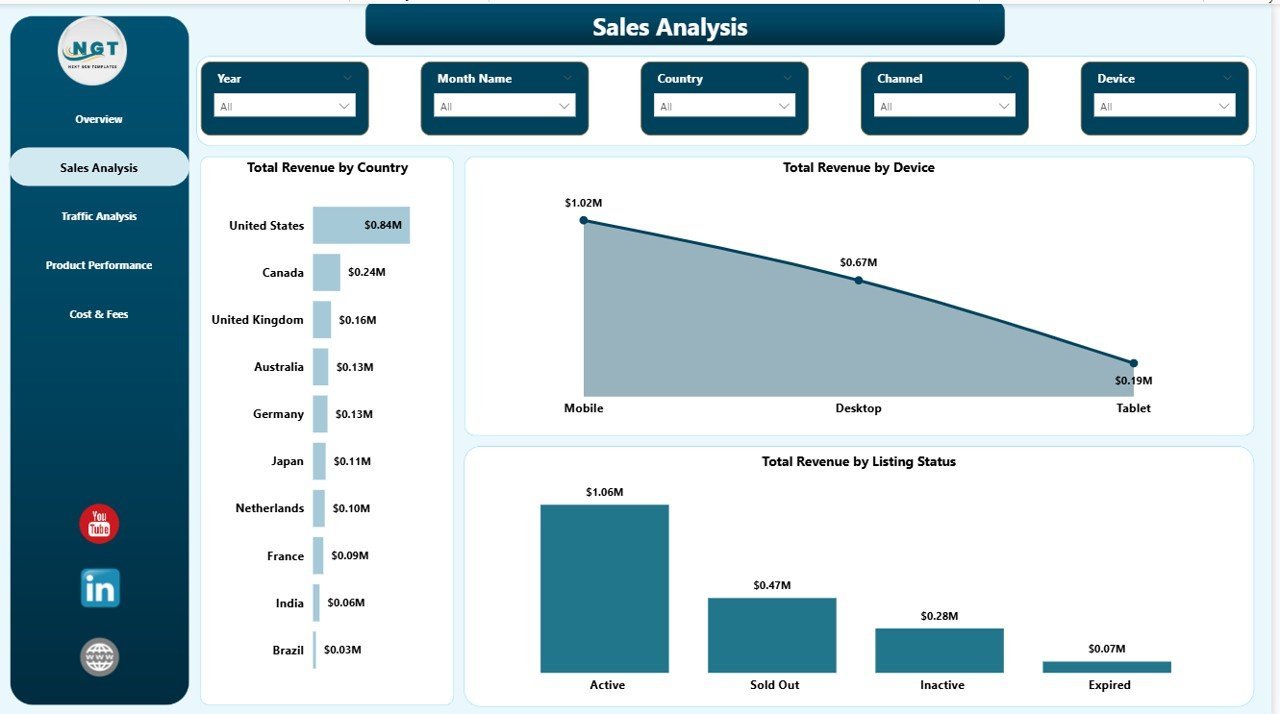
📌 Sales Analysis Page — Dive deeper into sales performance with Total Revenue by Country identifying your top-performing geographic markets, Total Revenue by Device comparing desktop vs mobile vs tablet revenue, and Total Revenue by Listing Status analyzing how active vs inactive listings contribute to your earnings.

Sales Analysis
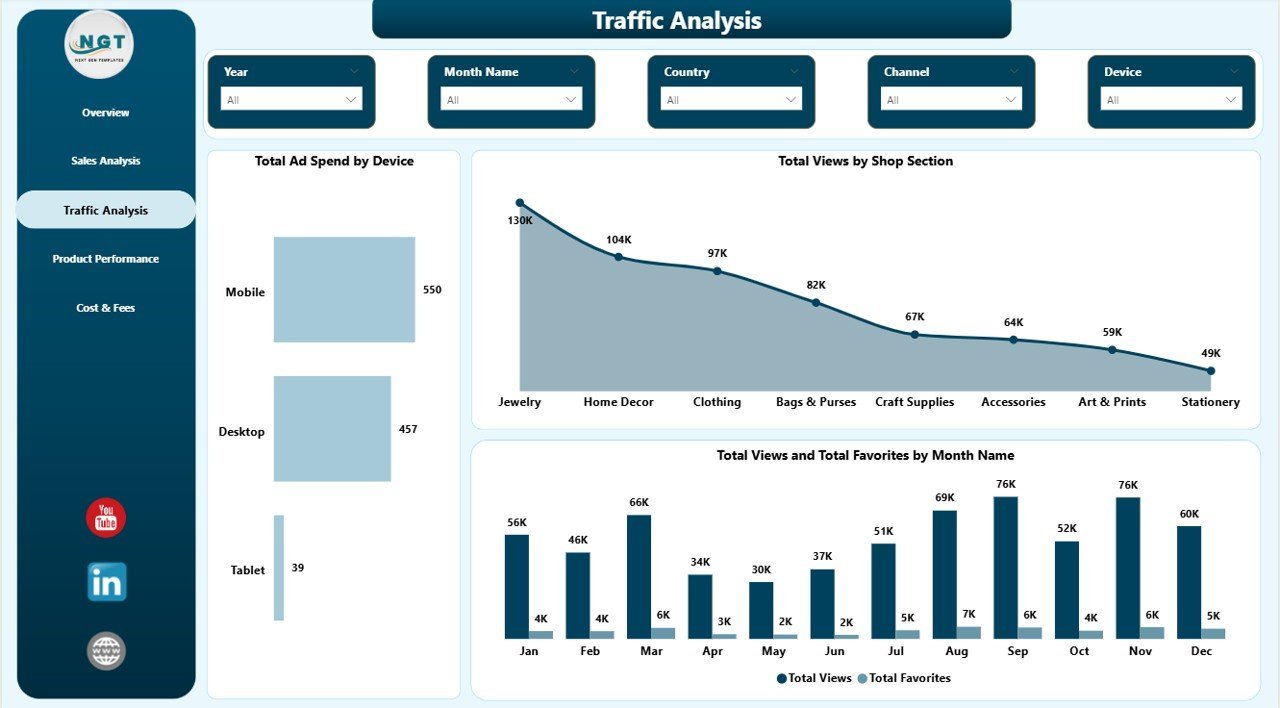
📌 Traffic Analysis Page — Monitor traffic patterns with Total Ad Spend by Device tracking advertising costs across devices, Total Views by Shop Section identifying your most-viewed product sections, and Total Views and Total Favorites by Month Name tracking monthly engagement trends and customer interest.

Traffic Analysis
📌 Product Performance Page — Analyze product-level metrics with Total Material Cost by Channel understanding cost distribution, Total Orders by Shop Section comparing order volume across product sections, and Total Orders by Country tracking geographic demand patterns.
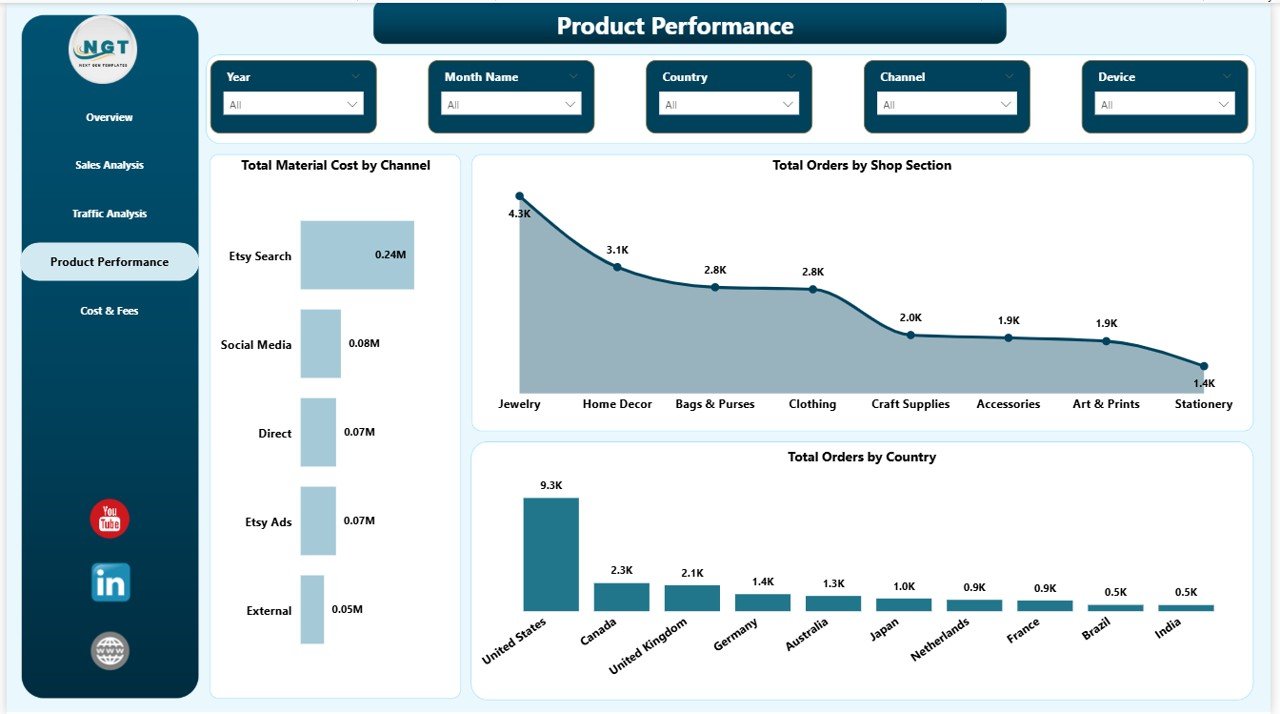
Product Performance
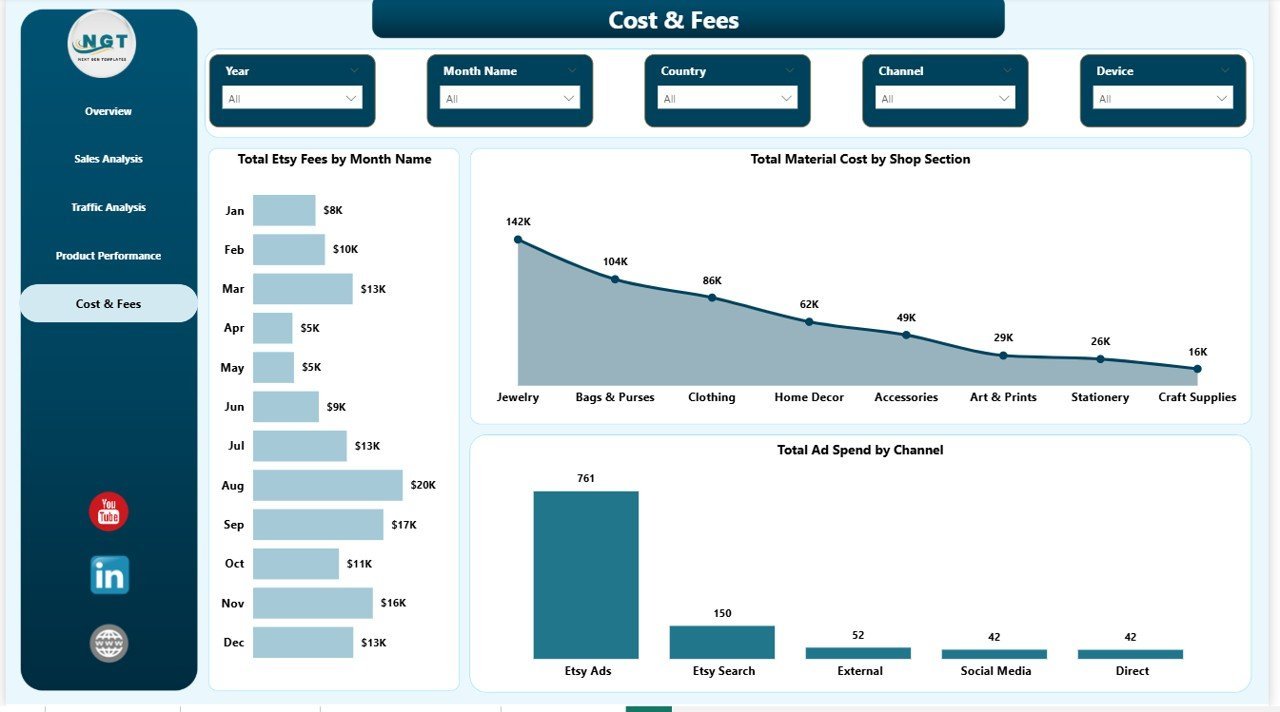
📌 Cost and Fees Page — Control operational expenses with Total Etsy Fees by Month Name monitoring platform fee trends over time, Total Material Cost by Shop Section tracking production costs across product sections, and Total Ad Spend by Channel analyzing advertising investment distribution.

Cost and Fees
⚙️ How to Use the Etsy Seller Analytics Dashboard in Power BI
1️⃣ Download and unzip the file to your computer.
2️⃣ Open the .pbix file in Power BI Desktop (free download from Microsoft).
3️⃣ Explore the sample data across all 5 dashboard pages to understand the layout and available analysis.
4️⃣ Replace the sample data source with your actual Etsy shop data.
5️⃣ Click Refresh in Power BI to update all charts and KPI cards automatically.
6️⃣ Use slicers and filters to drill down into specific channels, shop sections, countries, or time periods.
👥 Who Can Benefit from This Etsy Seller Analytics Dashboard
📌 Etsy shop owners tracking revenue, traffic, and ad spend across multiple product categories
📌 E-commerce managers analyzing sales performance across channels and devices
📌 Small business owners selling handmade, vintage, or digital products on Etsy
📌 Marketing teams measuring advertising ROI and traffic patterns
📌 Freelancers and consultants providing Etsy seller analytics reports to clients
❓ Frequently Asked Questions
What KPIs does the Etsy Seller Analytics Dashboard in Power BI track?
The Etsy Seller Analytics Dashboard in Power BI tracks 5 core KPIs on the Overview page: Total Revenue, Total Orders, Total Views, Total Etsy Fees, and Avg. Star Rating. It also includes 12+ charts across 5 pages covering revenue trends, traffic analysis, product performance, and cost tracking.
Do I need advanced Power BI skills to use this dashboard?
No. Simply open the .pbix file in Power BI Desktop, replace the sample data with your own Etsy records, and click Refresh. All charts, KPI cards, and visuals update automatically without any DAX editing or advanced knowledge required.
Can I track multiple Etsy shops with this template?
Yes. You can consolidate data from multiple Etsy shops into one data source. The slicers and charts will analyze all data together, giving you a unified performance view across shops.
How does this compare to the Excel version?
The Power BI version offers more advanced interactivity, cross-filtering between visuals, and the ability to connect directly to live data sources. The Excel version uses pivot tables and is ideal for users who prefer working entirely in Microsoft Excel.
What is the best Power BI dashboard for Etsy sellers?
The Etsy Seller Analytics Dashboard in Power BI from NextGenTemplates is one of the best options available. It includes 5 interactive pages covering overview metrics, sales analysis, traffic analysis, product performance, and cost tracking — all in a single .pbix file ready for immediate use with dynamic KPI cards and slicer-based filtering.
🔗 Explore Related Templates
📌 Etsy Seller Analytics Dashboard in Excel — The Excel version with pivot-powered analytics for Etsy sellers.
📌 Amazon FBA Seller Dashboard in Power BI — Track your Amazon FBA business with dedicated seller analytics in Power BI.
📌 Online Marketplaces KPI Scorecard in Excel — Monitor key performance indicators for your marketplace businesses.
Browse all Power BI Dashboard Templates and Sales and Marketing Templates for more analytics solutions.
📖 Click here to read the Detailed Blog Post
Watch the step-by-step video tutorial:


Reviews
There are no reviews yet.