


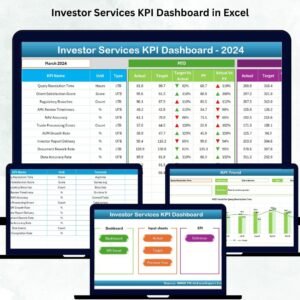
The ESG KPI Dashboard in Excel is a powerful tool for businesses looking to track, measure, and improve their Environmental, Social, and Governance (ESG) performance. This Excel-based dashboard helps organizations monitor their sustainability efforts and ensure they are meeting regulatory and stakeholder expectations regarding ESG criteria.
In today’s world, ESG reporting is becoming increasingly important for investors, consumers, and regulators. With this dashboard, companies can track their performance across key ESG metrics, identify areas for improvement, and present transparent, data-driven reports to stakeholders. This tool simplifies ESG monitoring by providing an intuitive interface to track important environmental, social, and governance data.
Key Features of the ESG KPI Dashboard in Excel
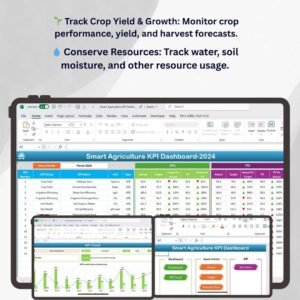
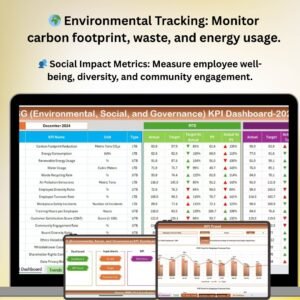
🌍 Environmental Impact Tracking
Monitor environmental KPIs such as carbon footprint, waste management, energy usage, and water conservation. Track progress in reducing environmental impact and achieving sustainability goals.
👥 Social Impact Monitoring
Measure social KPIs related to employee well-being, diversity and inclusion, community engagement, and human rights. Ensure that your business practices align with your social responsibility goals.
📜 Governance Compliance Tracking
Track governance KPIs, including compliance with regulations, transparency, ethical standards, and corporate governance policies. Monitor leadership practices, board diversity, and anti-corruption efforts.
📊 Real-Time Reporting & Data Visualization
Visualize your ESG performance with dynamic charts and graphs. Track trends and insights across key metrics to ensure that your organization stays on course with its ESG objectives.
📅 Customizable KPIs & Metrics
Tailor the dashboard to suit your organization’s specific ESG goals and priorities. Add custom categories or modify existing metrics to better reflect your ESG strategy and focus areas.
📈 Time-Based Performance Analysis
Evaluate ESG performance over time with historical data tracking. Identify trends, successes, and areas that require more attention to improve your ESG efforts and align with future goals.
Why You’ll Love the ESG KPI Dashboard in Excel

✅ Track and Improve ESG Performance
Stay on top of your environmental, social, and governance efforts. This dashboard allows you to monitor critical metrics and identify areas for improvement to achieve your sustainability goals.
✅ Transparent Reporting for Stakeholders
Present ESG data in a clear and organized format, making it easy for stakeholders, investors, and regulators to understand your organization’s commitment to sustainability.
✅ Data-Driven Decision Making
Use real-time data to make informed decisions about your ESG strategy. Monitor key performance indicators (KPIs) across environmental, social, and governance aspects to guide business actions.
✅ Customizable for Your Organization’s Needs
Adjust the dashboard to reflect your unique ESG goals and initiatives. Track custom metrics and make the tool work for your specific industry and organizational needs.
✅ Simplify ESG Reporting & Compliance
Automate and streamline your ESG reporting process, saving time and resources. Ensure compliance with sustainability regulations and standards while improving your public image.
What’s Inside the ESG KPI Dashboard in Excel?
- Environmental Impact Tracking: Monitor carbon footprint, energy usage, waste management, and more.
- Social Responsibility Metrics: Track diversity, inclusion, employee satisfaction, and community engagement.
- Governance Compliance Monitoring: Track compliance with governance policies, ethical standards, and anti-corruption measures.
- Data Visualization & Reports: Visualize ESG metrics and trends with dynamic charts and graphs.
- Customizable KPIs: Tailor the dashboard to suit your unique ESG priorities.
- Historical Data Analysis: Track ESG performance over different time periods to evaluate trends.
How to Use the ESG KPI Dashboard in Excel
1️⃣ Download the Template: Get instant access to the ESG KPI Dashboard in Excel.
2️⃣ Set Up ESG Goals & KPIs: Input your organization’s ESG targets and relevant metrics.
3️⃣ Track Performance: Monitor progress against set goals, track environmental, social, and governance metrics, and record data regularly.
4️⃣ Visualize Results: Use charts and graphs to evaluate your ESG performance and identify areas for improvement.
5️⃣ Report ESG Results: Create clear and concise ESG reports for stakeholders, investors, and compliance purposes.
Who Can Benefit from the ESG KPI Dashboard in Excel?
🔹 Sustainability Managers & Directors
🔹 ESG Compliance Officers
🔹 Corporate Social Responsibility (CSR) Teams
🔹 Environmental Consultants
🔹 Nonprofits & Environmental Organizations
🔹 Investors & Stakeholders Interested in ESG Metrics
🔹 Small & Medium Enterprises (SMEs) & Corporations
Ensure your organization’s commitment to sustainability and responsible governance with the ESG KPI Dashboard in Excel. Track, monitor, and report on your ESG efforts in real-time to make data-driven decisions and achieve long-term sustainability.
Click here to read the Detailed blog post
Visit our YouTube channel to learn step-by-step video tutorials
Youtube.com/@PKAnExcelExpert


Reviews
There are no reviews yet.