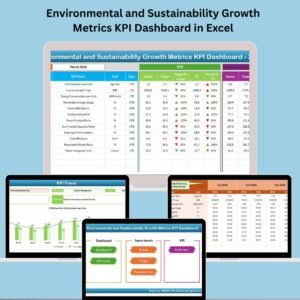
In today’s climate-conscious world, having a data-driven approach to your environmental goals isn’t just responsible—it’s essential. Whether you’re part of a corporate sustainability team, a nonprofit leader, or managing operations in the public sector, tracking the right KPIs makes all the difference. Introducing the Environmental and Sustainability Growth Metrics KPI Dashboard in Excel—a ready-to-use, fully customizable dashboard template that helps you track performance, stay compliant, and drive sustainable growth 📊🌍.
This Excel dashboard consolidates your key environmental metrics and turns them into interactive charts, indicators, and trendlines. It’s simple to use, powerful in function, and built entirely in Excel—no special software required.
💡 Key Features of Environmental and Sustainability Growth Metrics KPI Dashboard in Excel
📌 Month-to-Date & Year-to-Date Views

Get a clear comparison of actuals, targets, and last year’s values in both MTD and YTD format.
📈 Trend Analysis at a Glance
Visual charts and directional arrows quickly show you whether you’re improving or slipping.
🧩 7 Structured Sheets
From Dashboard to KPI Trend, every sheet is tailored for easy input, navigation, and updates.
🎯 Performance Benchmarking
Track your sustainability targets and adjust your strategy based on real-time insights.
🛠️ No Advanced Skills Needed
The tool is plug-and-play for any user familiar with Excel basics.
📂 What’s Inside the Environmental and Sustainability Growth Metrics KPI Dashboard?
1️⃣ Home Sheet
Your navigation hub with clickable buttons to all other sheets. Brand it with your company logo.
2️⃣ Dashboard Sheet
The main dashboard—select a month, and everything updates automatically. View MTD/YTD actuals, targets, PY values, and conditional arrows 📊📉📈.
3️⃣ KPI Trend Sheet
Choose any KPI and analyze its actual, target, and previous year performance in beautifully designed charts.
4️⃣ Actual Numbers Input Sheet
Manually enter monthly results. Select the starting month for your fiscal calendar 📅.
5️⃣ Target Sheet
Set monthly and YTD benchmarks for each KPI to define your sustainability goals 🎯.
6️⃣ Previous Year Sheet
Use this sheet to compare past performance and measure year-over-year improvement.
7️⃣ KPI Definition Sheet
Store all KPI metadata like name, formula, unit, type (UTB/LTB), and definition—your single source of truth 📘.
🔍 How to Use the Environmental KPI Dashboard
-
Enter Monthly Results in the Actual Numbers sheet.
-
Update Targets in the Target sheet.
-
Load Previous Year Data in the respective sheet.
-
Select Your Month from the dropdown in the Dashboard.
-
Review Performance instantly with arrows and conditional highlights.
No complex formulas to write. No external tools required. Everything runs natively in Excel!
👥 Who Can Benefit from This Dashboard?
This dashboard is perfect for:
-
✅ Sustainability Managers
-
✅ Environmental Analysts
-
✅ CSR Teams
-
✅ NGOs and Educational Institutions
-
✅ Government Agencies
-
✅ Corporate ESG Departments
-
✅ Operations and Compliance Officers
Whether you’re reporting to the board or preparing ESG reports, this template makes your data storytelling effective and visually engaging.
🔗 Click here to read the Detailed blog post
📺 Visit our YouTube channel to learn step-by-step video tutorials















Reviews
There are no reviews yet.