In a world where sustainability and energy efficiency define success, data-driven decisions are no longer optional — they’re essential. The Energy Dashboard in Power BI empowers organizations to monitor, analyze, and optimize energy performance in real time.
Built on Microsoft Power BI, this interactive and fully customizable dashboard transforms raw consumption data into actionable insights. Whether you manage corporate facilities, regional projects, or sustainability programs, this dashboard helps you identify inefficiencies, track savings, and promote a greener, more efficient future.
⚙️ Key Features of the Energy Dashboard in Power BI
📊 Five Analytical Pages for Comprehensive Insights:
Includes Overview, Department Analysis, Region Analysis, Project Analysis, and Monthly Trends pages — each delivering a focused view of your energy performance.
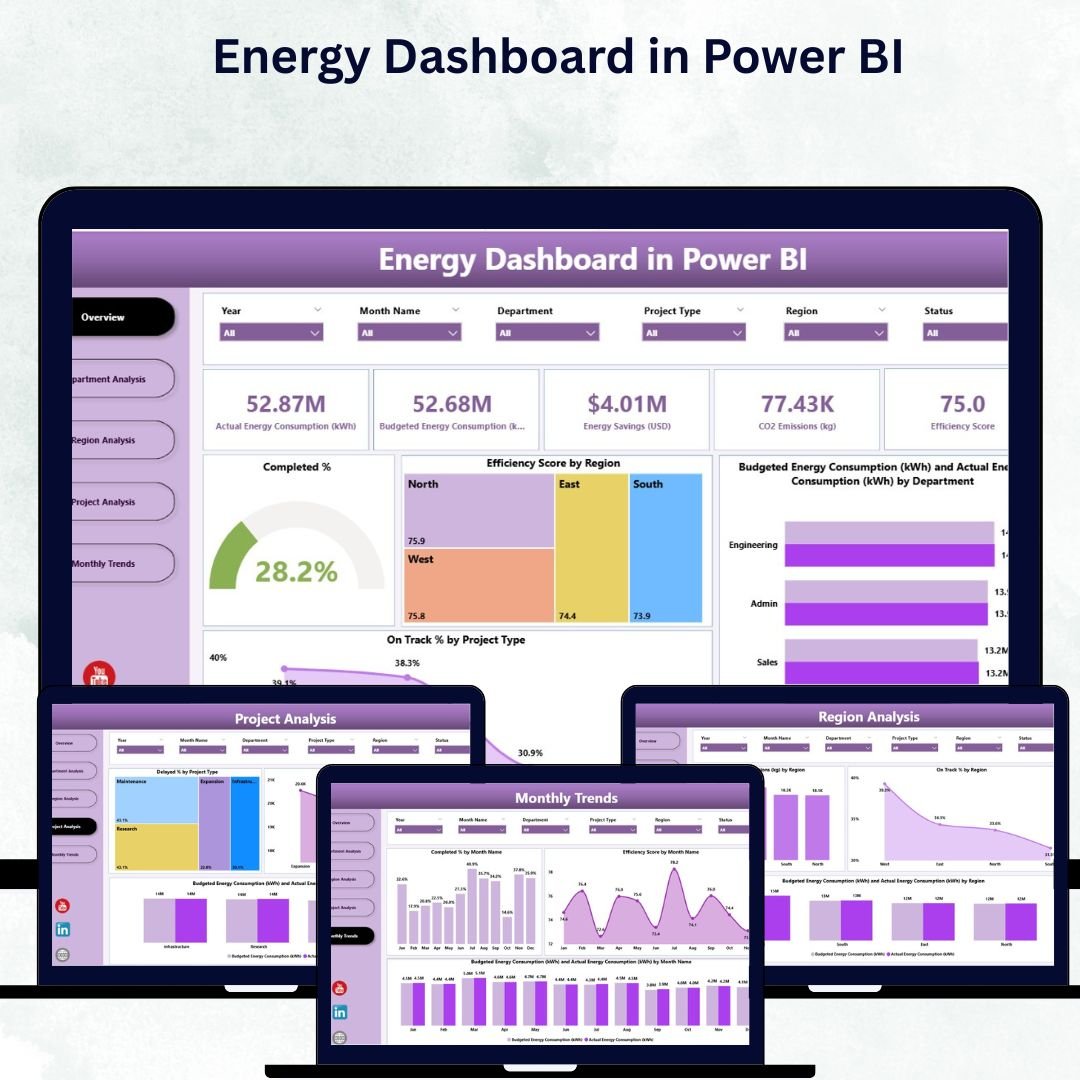
🎯 Overview Page – The Control Center:
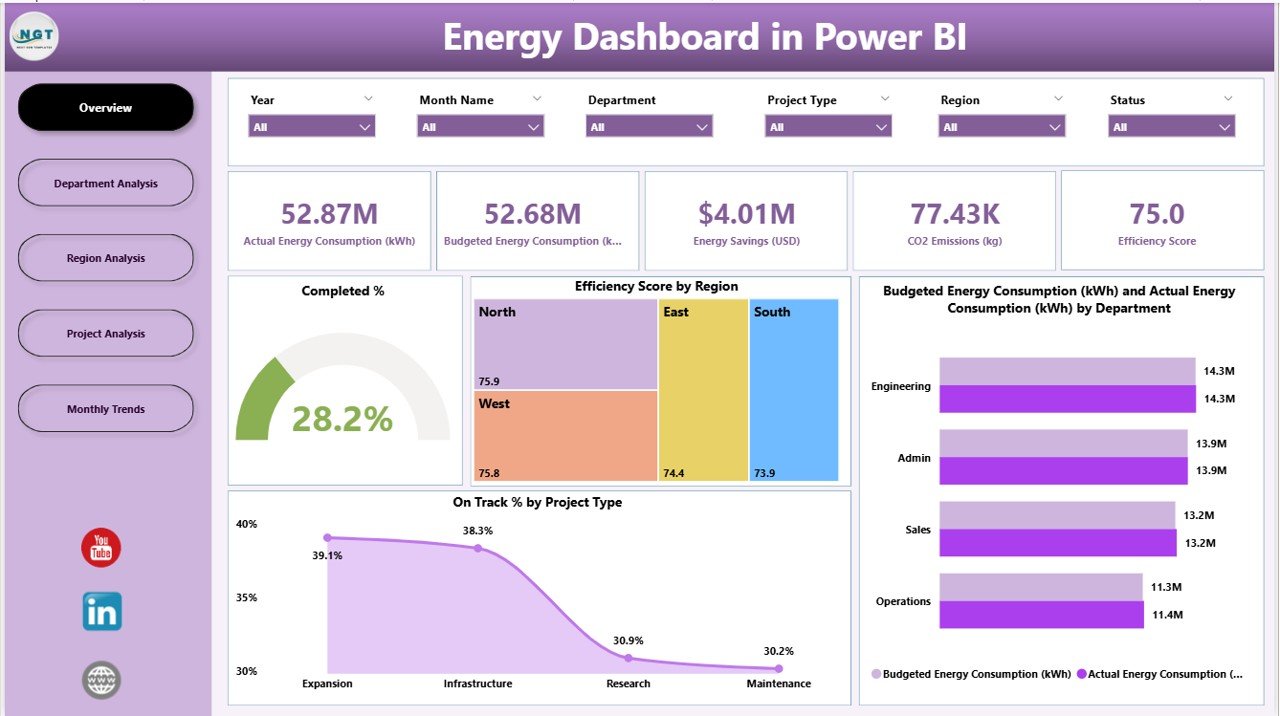
Get a quick, high-level summary of energy efficiency across the organization.
-
Dynamic Slicers to filter by time, department, or region.
-
KPI Cards for Total Efficiency, Energy Savings, Completed %, and On-Track %.
-
Key Charts:
-
Completed %
-
Efficiency Score by Region
-
Budgeted vs Actual Energy (kWh) by Department
-
On-Track % by Project Type
-
This page offers instant visibility for leadership and sustainability officers.
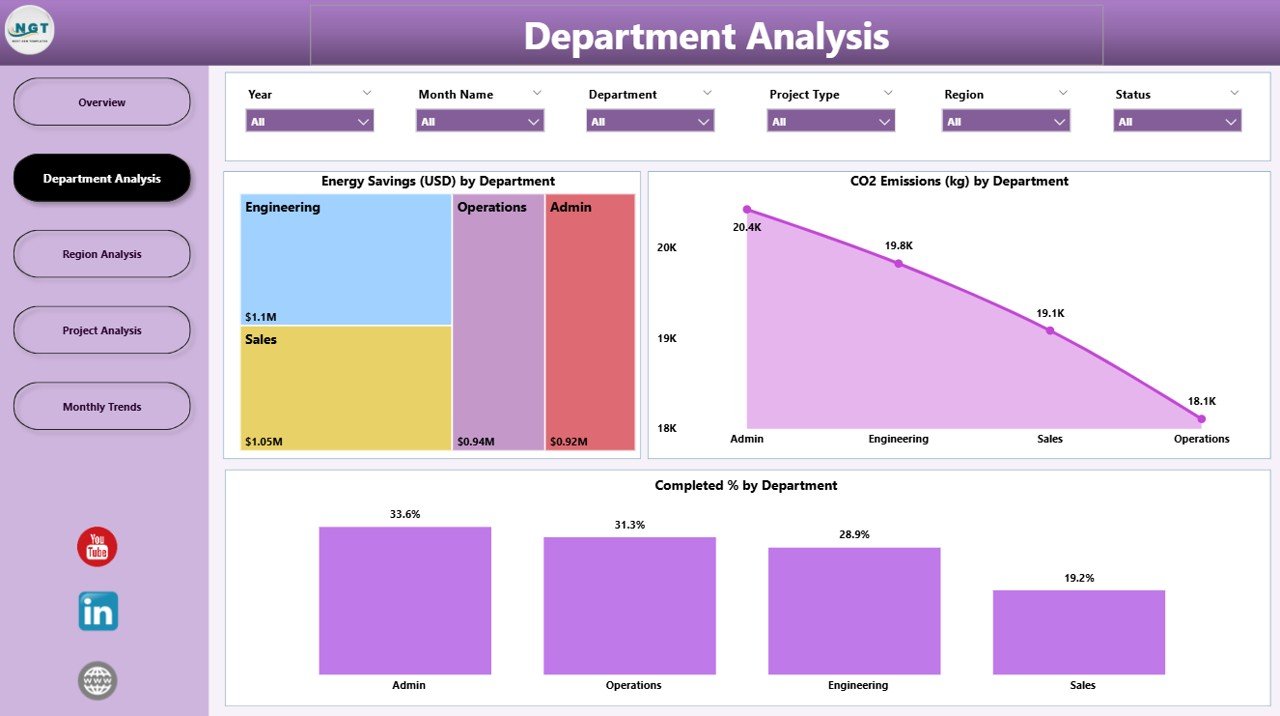
🏢 Department Analysis Page – Drill into Performance:
Understand energy consumption and savings across business units.
-
Energy Savings (USD) by Department
-
CO₂ Emissions (kg) by Department
-
Completed % by Department
Identify which departments drive progress and which need improvement.
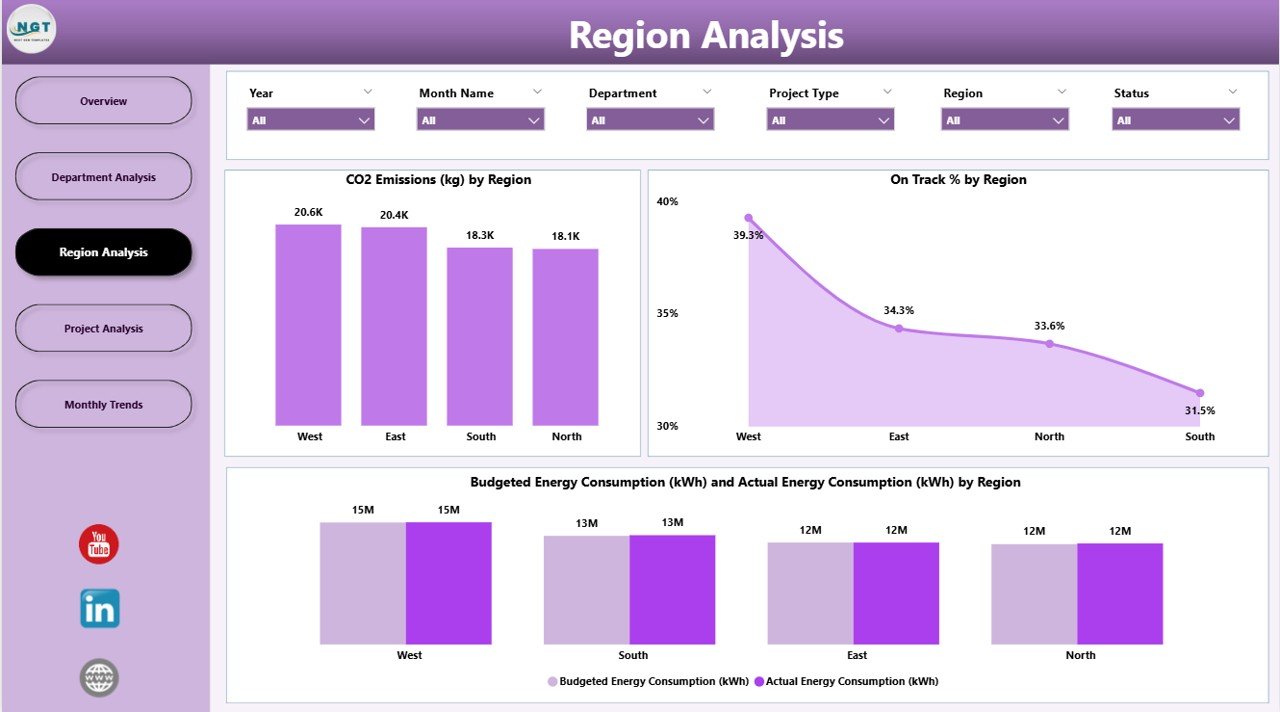
🌍 Region Analysis Page – Geographical Insights:
Compare efficiency across multiple locations.
-
CO₂ Emissions (kg) by Region
-
On-Track % by Region
-
Budgeted vs Actual Energy Consumption (kWh) by Region
Perfect for companies with multi-site operations looking to balance performance globally.
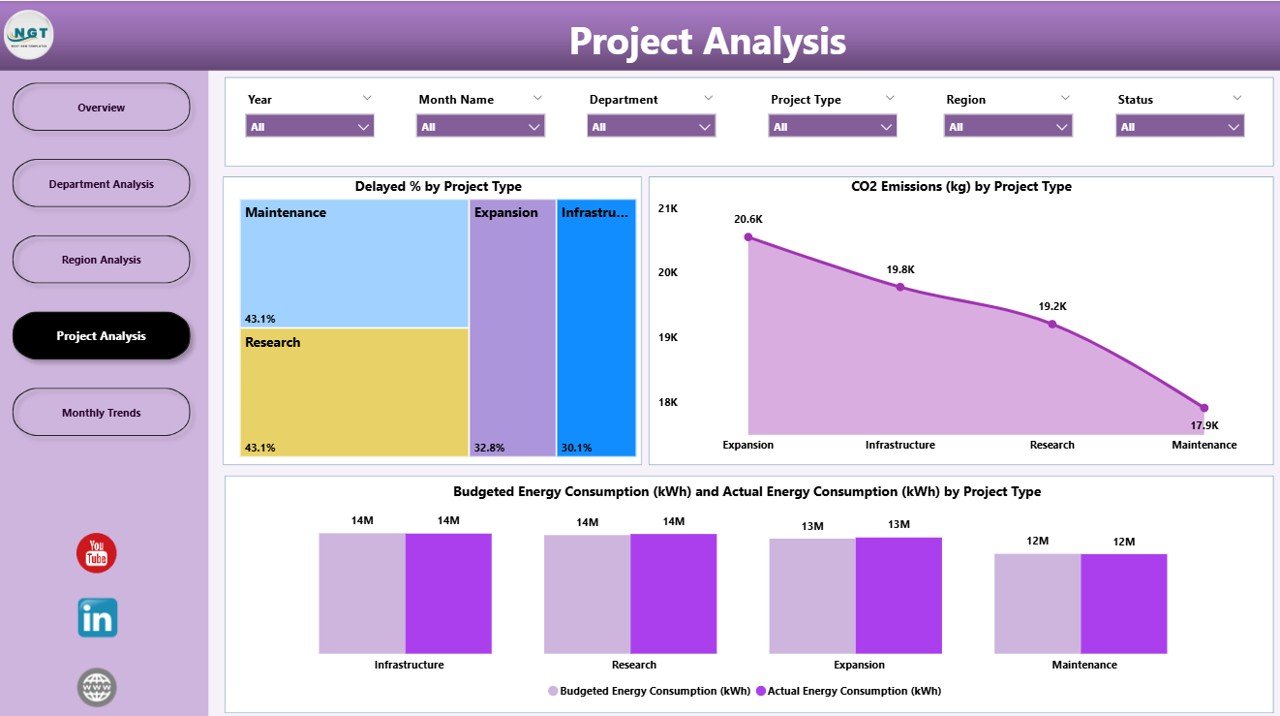
📁 Project Analysis Page – Evaluate Impact:
Track project efficiency, budget, and sustainability.
-
Delayed % by Project Type
-
CO₂ Emissions (kg) by Project Type
-
Budgeted vs Actual Energy (kWh) by Project Type
Ensure every initiative stays aligned with goals and deadlines.
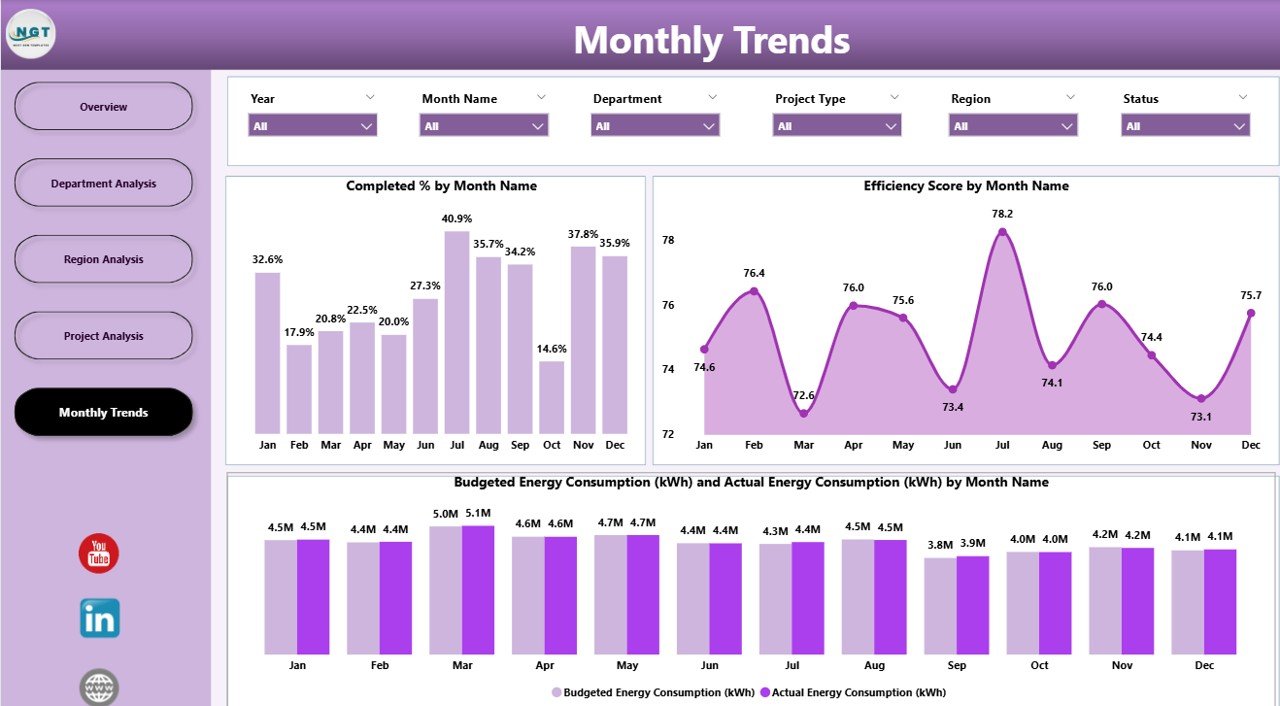
📅 Monthly Trends Page – Track Seasonal Patterns:
-
Completed % by Month
-
Efficiency Score by Month
-
Budgeted vs Actual Energy (kWh) by Month
Spot trends, forecast consumption, and plan proactive energy strategies.
📊 What’s Inside the Energy Dashboard in Power BI
1️⃣ Overview Page: High-level KPI summary and executive metrics.
2️⃣ Department Analysis Page: Operational efficiency insights by team.
3️⃣ Region Analysis Page: Comparative visuals across global locations.
4️⃣ Project Analysis Page: Progress tracking and sustainability focus.
5️⃣ Monthly Trends Page: Time-based trend visualization for forecasts.
Together, these five pages deliver a 360° view of energy efficiency — helping organizations reduce costs and meet sustainability targets with precision.
🧭 How to Use the Energy Dashboard in Power BI
✅ Step 1: Connect Excel, IoT, or ERP data sources to Power BI.
✅ Step 2: Refresh data to visualize real-time performance metrics.
✅ Step 3: Filter by region, department, or project to pinpoint trends.
✅ Step 4: Monitor KPIs such as Energy Savings, CO₂ Emissions, and Efficiency %.
✅ Step 5: Share the live dashboard via Power BI Service for collaborative decisions.
In minutes, you’ll turn scattered data into clear visual insights that drive smarter sustainability actions.
👥 Who Can Benefit from This Dashboard
🏭 Manufacturing Companies: Monitor energy use per production unit.
🏢 Corporate Facilities Teams: Track energy efficiency across buildings.
🏗️ Construction Firms: Measure sustainability in green projects.
🛒 Retail Chains: Compare energy costs across stores.
🏥 Healthcare Institutions: Maintain reliable power for critical systems.
🌱 Government & Public Sector: Report sustainability and emission KPIs transparently.
🌟 Advantages of the Energy Dashboard in Power BI
✅ Centralized Data: Combine energy data from multiple sources into one unified system.
✅ Real-Time Visibility: Track energy savings and efficiency KPIs instantly.
✅ Cost Optimization: Identify waste and budget overruns proactively.
✅ Sustainability Reporting: Monitor CO₂ emissions and energy-saving initiatives.
✅ Automation Ready: Use scheduled data refresh for live updates.
✅ Scalable Design: Suitable for small businesses or global enterprises.
✅ User-Friendly: No coding skills required — just connect, refresh, and analyze.
🔗 Click here to read the Detailed Blog Post
🎥 Visit our YouTube channel for step-by-step tutorials
🔗 YouTube.com/@PKAnExcelExpert


Reviews
There are no reviews yet.