
Workplace safety should never be reactive, delayed, or guess-based. Yet many organizations still rely on scattered Excel files, manual registers, and outdated reports. The Employee Health and Safety Dashboard in Power BI changes that completely.
This professionally designed, ready-to-use Power BI dashboard gives you real-time visibility into workplace incidents, risks, and preventive actions—all in one interactive solution. Instead of spending hours compiling reports, you get instant insights that help you reduce incidents, protect employees, and stay compliant.
Whether you manage safety for a factory, corporate office, construction site, or multi-location organization, this dashboard empowers you to move from reactive safety management to proactive prevention.
## 🚀 Key Features of Employee Health and Safety Dashboard in Power BI
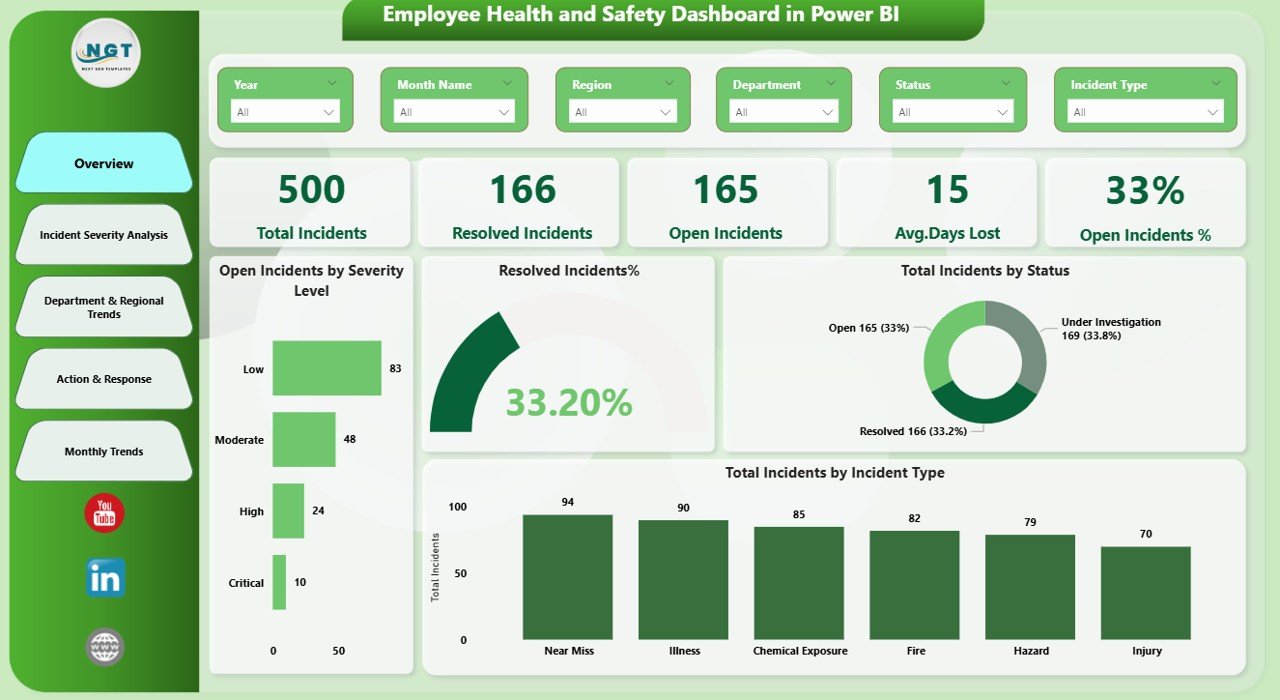
📊 Centralized Safety Monitoring
Track incidents, severity levels, lost days, and resolution status from a single dashboard.
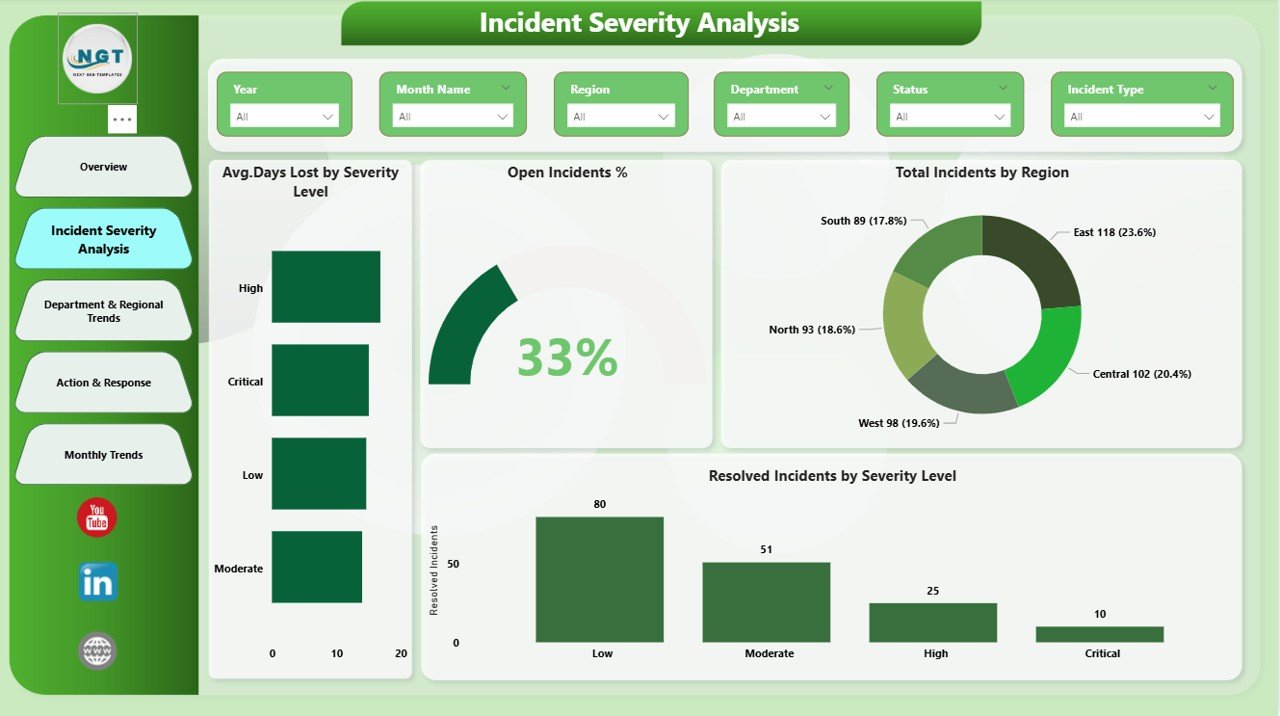
⚠️ Incident Severity Intelligence
Identify which severity levels cause maximum damage and productivity loss.
🏢 Department & Regional Risk Analysis
Spot high-risk departments and regions instantly to take targeted action.
🛠️ Preventive Action Tracking
Evaluate whether safety actions are actually reducing workplace risks.
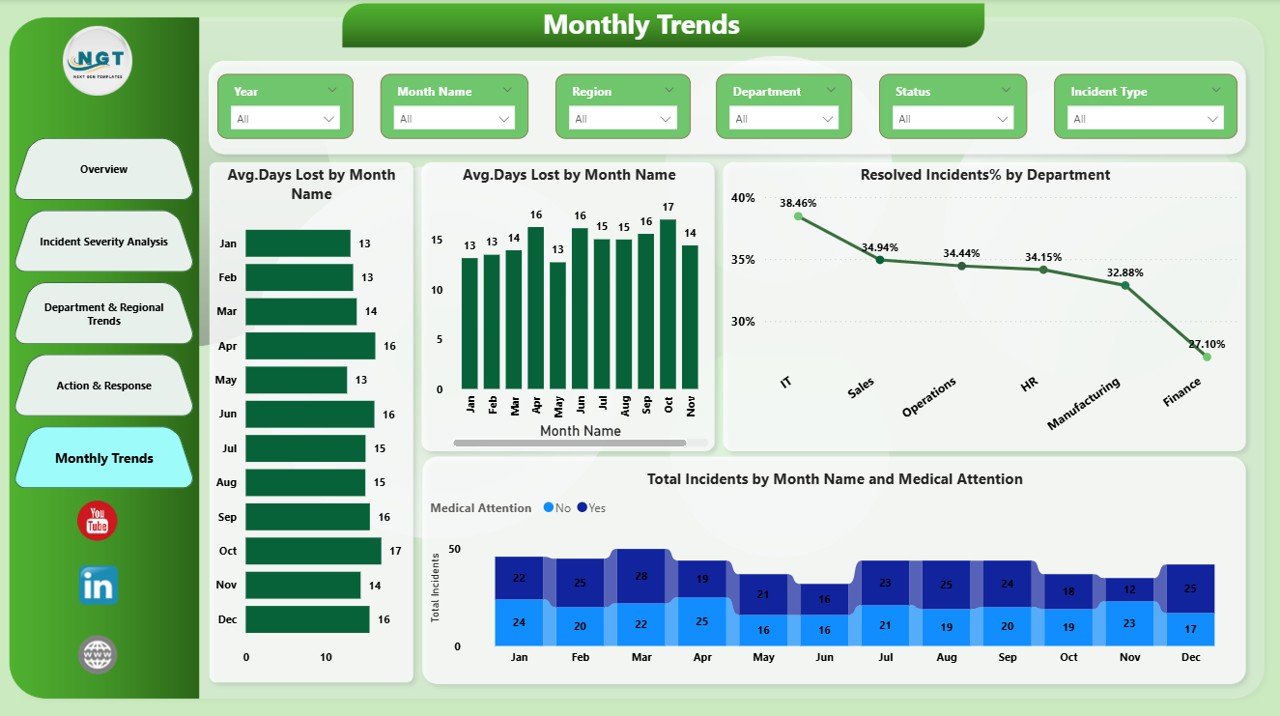
📅 Trend-Based Safety Insights
Monitor monthly safety trends to measure improvement or detect early warnings.
🎯 Interactive Filters & Slicers
Analyze data by department, region, incident type, or time period with ease.
📈 Leadership-Ready Visuals
Clean KPIs, charts, and summaries designed for quick decision-making.
## 📦 What’s Inside the Employee Health and Safety Dashboard in Power BI
This Power BI dashboard includes 5 fully structured analytical pages, each designed to answer a critical safety question:
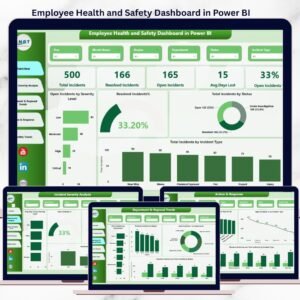
🔹 Overview Page
Get a real-time snapshot of total incidents, open cases, days lost, severity breakdowns, and resolution performance.
🔹 Incident Severity Analysis
Analyze incidents by severity level, region, and resolution efficiency to prioritize high-impact risks.
🔹 Department & Regional Trends
Understand which departments and regions contribute most to incidents and unresolved cases.
🔹 Action & Response Analysis
Measure the effectiveness of preventive actions and incident response strategies.
🔹 Monthly Trends Page
Track safety performance over time to ensure continuous improvement.
Each page is designed to deliver clear, actionable insights without technical complexity.
## 🧩 How to Use the Employee Health and Safety Dashboard in Power BI
Using this dashboard is simple—even for non-technical users:
1️⃣ Connect your safety data (Excel or structured data source)
2️⃣ Refresh the Power BI file
3️⃣ Use slicers to filter by department, region, severity, or time
4️⃣ Review KPIs and trends
5️⃣ Take data-driven corrective actions
No advanced Power BI skills required. Just update the data and start analyzing.
## 👥 Who Can Benefit from This Employee Health and Safety Dashboard
🏭 Manufacturing & Industrial Companies
🏗️ Construction & Infrastructure Firms
🏢 Corporate Offices & Enterprises
🏥 Healthcare & Facility Management Teams
📊 Safety Managers & EHS Professionals
📋 HR, Compliance & Audit Teams
👔 Leadership & Operations Managers
If workplace safety, compliance, and productivity matter to your organization—this dashboard is built for you.
Click here to read the Detailed blog post
Watch the step-by-step video tutorial:


Reviews
There are no reviews yet.